2008/2009.
2009-01-05 17:30:57.000 – Ryan Knapp, Staff Meteorologist
A blank slate.
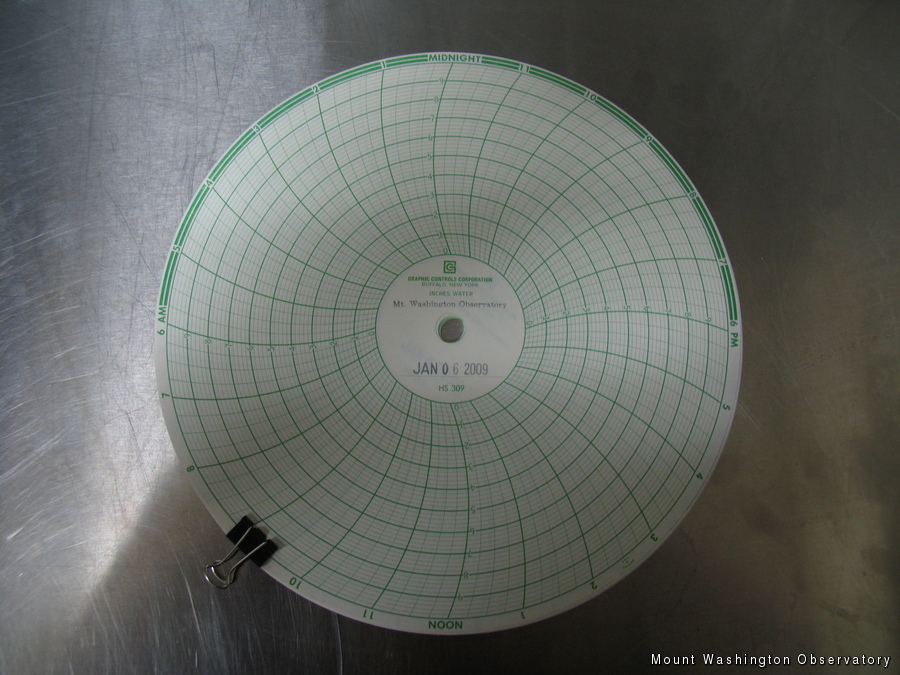
The year 2008 came to a close on Wednesday and I ushered in 2009 the same way I usher in every new day on the summits – changing our recording charts. While the rest of the crew was watching the ball drop, I waited upstairs counting down to midnight (as always) and then quickly switching out the old charts with new blank charts. In the back of my mind though, I looked at the Hays chart and could not help but think of a few metaphors for this particular night.
But before I run down on metaphors, a quick lesson on the Hays: The Hays chart is connected to our pitot-tube static anemometer (I am not going to discuss how this works since it has been talked about before. But if you would like more information, my coworker Brian has blogged about it here.). Through a series of tubing, the wind pressure pushes a needle back and forth on our Hays recorder to represent the activity of the wind. Like I tell our visitors, the thicker the red line is, the gusty the winds are and the further away the red line is from the center, the higher the wind speeds are. Although we still use this device as backup, most instrumentation is digitized now and days so the chart is more for show than anything else on most days.
So looking at the chart on December 31st, 2008, it is marked by highs and lows with varying amplitude. This could be related to life or to the past year. It might be the highs of graduation, the birth of a new child, getting promoted, winning the lottery, or buying your first house. The lows might be losing a dog or loved one, losing a job, being lost in the woods, or divorce. The amplitude (or thickness of the line) would be the frequency of which the good and the bad come at you. Sometimes it is narrow meaning it is a series of good or bad events. Other times, it is wide meaning the good and bad come at your in concession meaning one day might be good while the other is bad. Eventually these periods pass and things smooth out once again.
And then there is the change. For the Hays, it means putting on a blank chart for the day. This signifies a blank slate, a fresh start, and limitless possibilities. Would the first day of the new year be a calm day or a wild ride filled with tons of highs and lows? (It ended up being really windy). How about the rest of the year? As the clock hit midnight on the New Year, most people looked at the coming year with a blank slate, a fresh start and limitless possibilities. Would the economy pick up? Will I get promoted? Or will I stick to my resolution and visit the gym three days a week? The fact is we don’t know. What has occurred is done, recorded and stored. What is to come is waiting, unknown and still waiting to be written. Good day or bad, think to yourself when you wake up like I do when changing the chart, ‘What will today bring?’
Ryan Knapp, Staff Meteorologist
Team Flags Return for Seek the Peak’s 25th Anniversary
Team Flags Return for Seek the Peak's 25th Anniversary By MWOBS Staff Mount Washington Observatory is looking forward to continuing a much-loved tradition for Seek the Peak’s 25th Anniversary: Team flags. In inviting teams
Meet Summer Interns Zakiya, Max and Maddie
Meet Summer Interns Zakiya, Max and Maddie By MWOBS Staff We are excited to welcome six teammates to the summit of Mount Washington this summer! During their internship, these students and graduates will play
Saying Goodbye to the Summit
Saying Goodbye to the Summit By Alexis George After an extraordinary last three years working as a Weather Observer and Meteorologist, I am excited to pursue a different career. As sad I as am


