El Niño and Its Influences on Weather
Francis Tarasiewicz, Weather Observer & Education Specialist
As we enter the fall season, it’s clear that 2023 has been a year filled with meteorological buzzwords. Phrases like “polar vortex,” “heat dome,” and “bomb cyclones” have inundated the public with an overwhelming amount of weather terminology. One particular term that has gained prominence this year is “El Niño.”
Although technically more of a climate phenomenon, “El Niño” has become a familiar figure in meteorology, akin to that eccentric uncle everyone knows. Whether you’re a high-ranking expert at the National Oceanic and Atmospheric Administration (NOAA) or just tuning in to your local TV meteorologist’s idiosyncrasies, “El Niño” seems to be everywhere. But as its popularity has grown, so have the misconceptions and misattributions surrounding it. From clickbait articles predicting meteorological doomsday to overly confident amateur winter weather enthusiasts swearing that “El Niño” guarantees a record-breaking East Coast winter, it appears that “El Niño” has become the scapegoat for meteorological events in 2023.
In this blog, I aim to explain the drivers of El Niño and, more broadly, the El Niño Southern Oscillation (ENSO). We’ll delve into its current state, where it’s heading, and the million-dollar question: what does it mean for winter in the United States?
ENSO has a lengthy and impactful history. Human beings have observed its effects for at least the last 499 years. In 1524, Spanish conquistador Francisco Pizarro’s expedition faced strong southeasterly winds, which hindered their progress along the west coast of South America. The following year, they encountered more favorable northeasterly winds that allowed them to journey farther south. As they moved inland, they discovered wetter than usual conditions in otherwise arid parts of Peru and Ecuador. Little did they know that they were witnessing El Niño’s wet signature along the western coast of South America. However, ENSO hasn’t always brought favorable outcomes. The late 1800s saw a series of global famines, some attributed to disruptions in atmospheric circulations caused by El Niño. These disruptions, particularly in the monsoon circulation, led to the deaths of millions in China and India.
You might be tempted to believe the extreme headlines suggesting that El Niño is a menacing force destined to bring catastrophic events. But before anyone panics, let’s take a closer look at this climate control mechanism. ENSO can be summarized as a regular cycle of sea surface temperature changes across the equatorial Pacific, occurring every two to seven years.
These temperature changes are driven by shifts in sea-level air pressure patterns over the tropical Pacific. The Southern Oscillation Index (SOI) measures these pressure changes by comparing air pressure differences between weather stations in Darwin, Australia, and Tahiti. When Darwin experiences lower air pressure, it creates an east-to-west airflow that draws warmer surface ocean water towards Australia. The movement of water allows for deeper and colder waters to fill the partial void left by the stronger winds. This process, known as upwelling, results in colder-than-average temperatures across the equatorial Pacific, a condition known as La Niña.
Conversely, during El Niño, the east-to-west trade winds slow or even reverse, reducing upwelling and warming the ocean’s surface layer in the equatorial Pacific.
You might wonder why we monitor a narrow band of ocean temperatures thousands of miles away. The answer lies in the ocean’s impact on convection, or thunderstorm activity. The tropics are a hotbed for thunderstorms, and during an El Niño event, warmer waters supercharge convection over the tropical Pacific. Changes in the concentration of convection can significantly alter the jet stream’s configuration, affecting precipitation patterns and drought development.
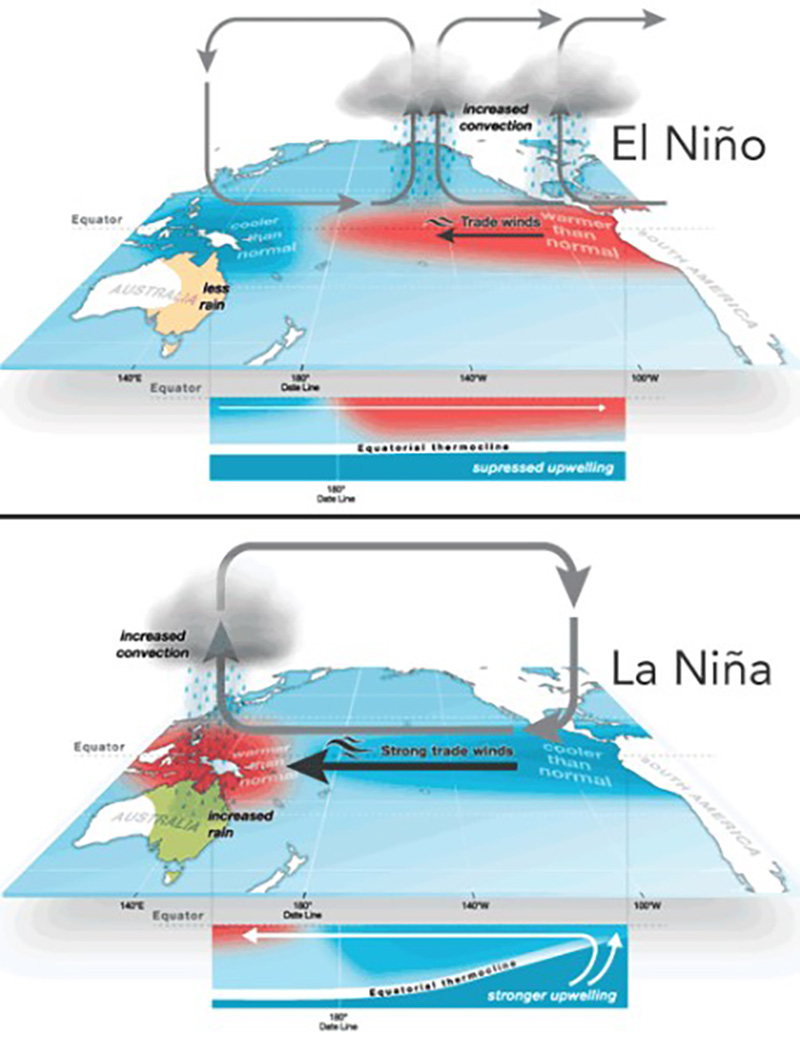
Schematic diagram showing the difference in air movement and convection between El Nino and La Nina events. Bureau of Meteorology image.
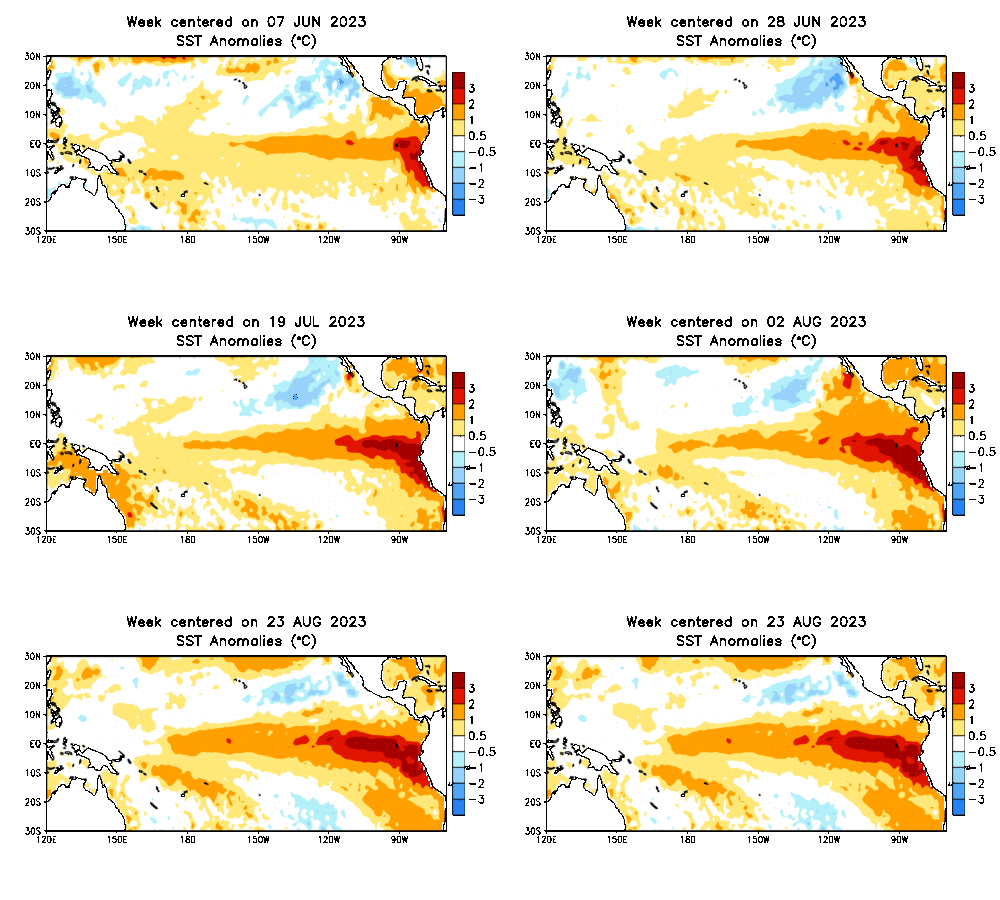
Now that we’ve covered the basics of ENSO, let’s examine its current status. At the time of writing this blog, ENSO is firmly in El Niño territory, with temperature anomalies continuing to rise. The warmest sea surface temperature anomalies are currently near the west coast of South America, where water temperatures are a remarkable 3°C (5.4°F) above average

Loop of weekly Sea Surface Temperature (SST) anomalies around the equatorial Pacific (Jun-Aug).
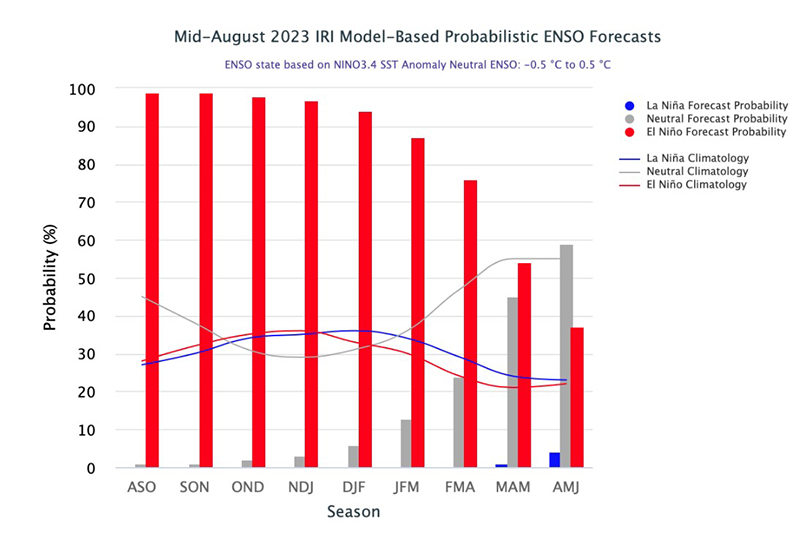
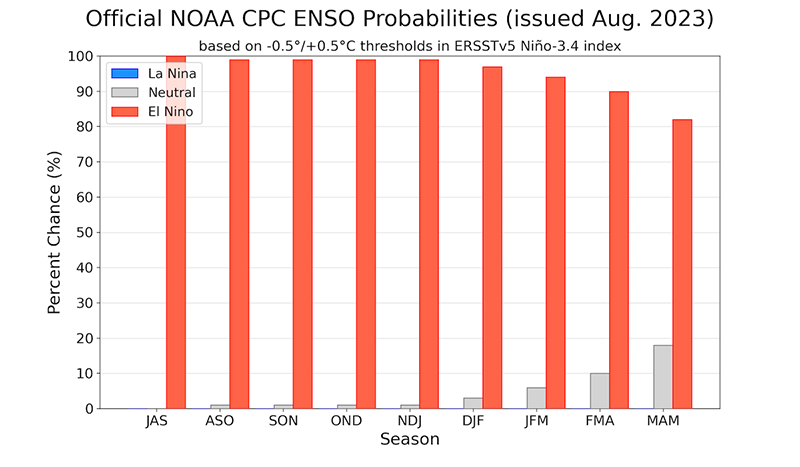
Climate and Society (IRI) predict a 90-100% chance of El Niño conditions through at least January. The probability remains above 50% through March before dropping to 37% by April. The Climate Prediction Center (CPC) also maintains at least an 80% chance of El Niño through next spring. The crucial point in both forecasts is the expectation of El Niño conditions throughout the winter. The next section will address what this might mean for winter weather in the United States.
To predict how an El Niño winter might unfold, let’s examine past events. We’ll start by looking at the jet stream, located high in the troposphere at about 40,000 feet (200mb). The behavior of the jet stream is essential because it influences everything from storm tracks to precipitation and temperature patterns. When analyzing the zonal (west-to-east) jet stream anomalies during the last ten El Niño events, we see that, on average, the northern or Polar jet weakens compared to normal. Conversely, the southern or subtropical branch of the jet stream becomes stronger during El Niño, driven by increased convection across the Pacific. This can lead to an active storm track across the southern United States, occasionally resulting in Nor’easters for the Northeast. In contrast, during La Niña, the polar jet tends to be slightly stronger than normal, while the subtropical jet weakens.
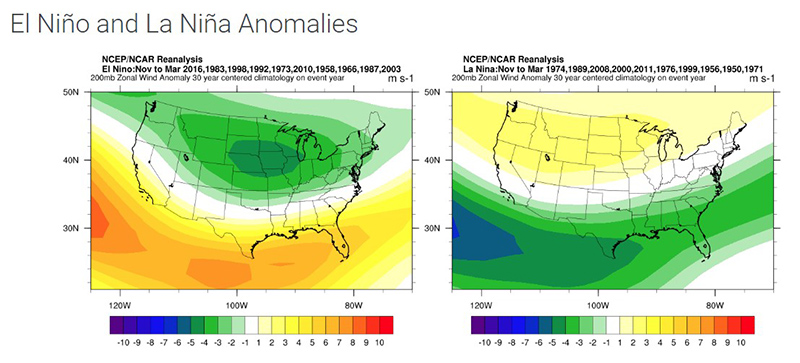
200mb wintertime zonal wind anomalies for El Nino (left) and La Nina (right).
Another crucial factor for understanding seasonal behavior is the 500mb heights, which describe the atmospheric height at the 500mb level. Higher heights indicate warmer atmospheric conditions, while lower heights signify cooler conditions and stormier weather. During an El Niño winter, the lowest 500mb anomalies are typically found across the southern and western United States, with a concentration of lower heights in the mid-south. These anomalies result from the active subtropical jet, which spawns frequent storms moving from west to east across the southern US. Further north, a weakened polar jet can lead to higher heights and warmer temperatures, particularly in the upper Midwest and New England. La Niña reverses this pattern, with higher heights and temperatures in southern areas and lower values in the northern US and the Pacific Northwest.
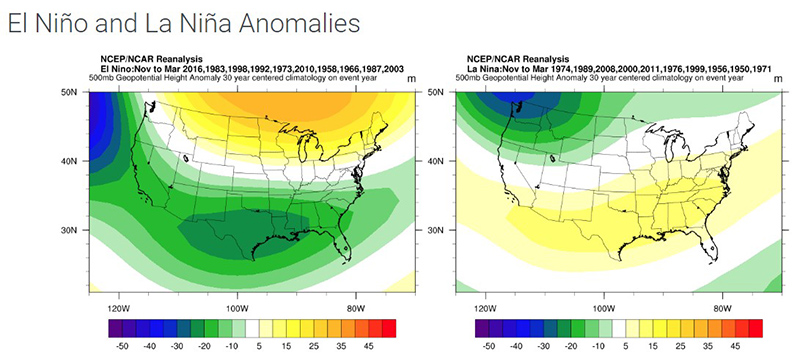
500 mb wintertime geopotential height anomalies for El Nino (left) and La Nina (right).
The most noticeable impacts on wintertime precipitation anomalies occur along a belt stretching from California to the Southeast and roughly along the I-95 corridor on the eastern seaboard. During an El Niño winter, the increased southern storm track leads to more regular precipitation, particularly in the southeast, where anomalies can range from 1 to 5 inches above normal. Conversely, parts of the Pacific Northwest and Ohio tend to experience drier conditions as most storm tracks are south of these areas. La Niña flips these patterns, with precipitation anomalies shifting locations and magnitude.
Winter anomalies become more evenly distributed from north to south, with storm tracks once again playing a significant role. The southern US, experiencing wetter and stormier conditions, is more likely to see cooler-than-average temperatures, while the northern US generally leans toward warmer temperatures. The warmest anomalies are typically found in the upper Midwest, northern New England, and the Pacific Northwest. Warmer temperature departures dominate most of the country during a La Niña event, except for the western US and some parts of the upper Midwest.
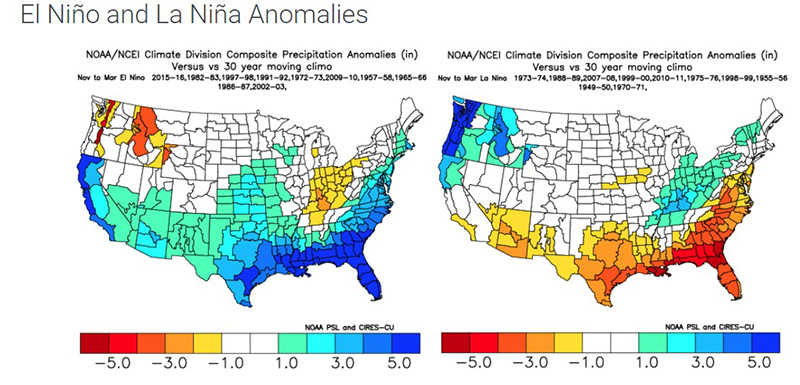
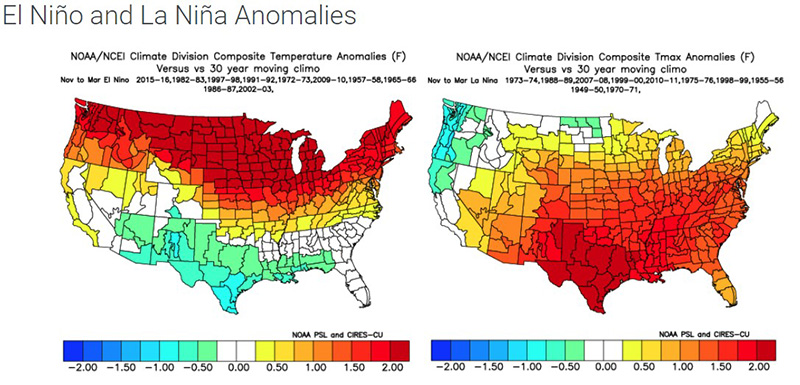
Wintertime temperature anomalies for El Nino (left) and La Nina (right).
In summary, what do all these variables imply for the upcoming winter? Where will storms track, and will there be blizzards or a salvageable ski season?
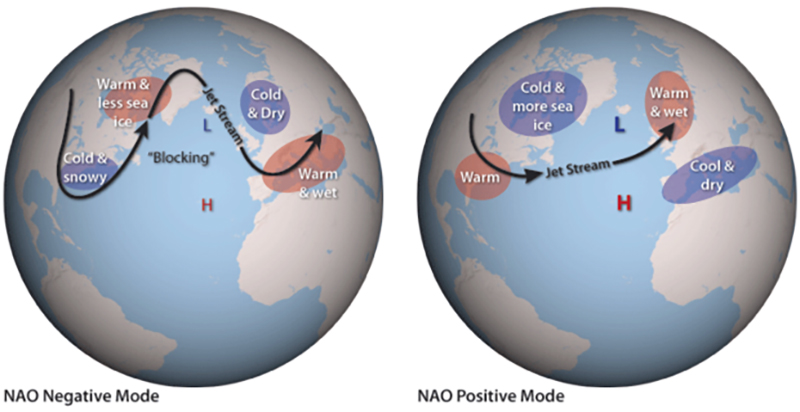
It’s essential to note that NOAA won’t issue its annual winter outlook for another two months. While we can speculate about increased storm activity and possible warmth in the northern US, making a definitive forecast at this point is challenging due to the numerous variables at play. Moreover, ENSO’s primary impact tends to be on the west coast, whereas our seasonal variability on the east coast is largely influenced by the North Atlantic Oscillation (NAO).
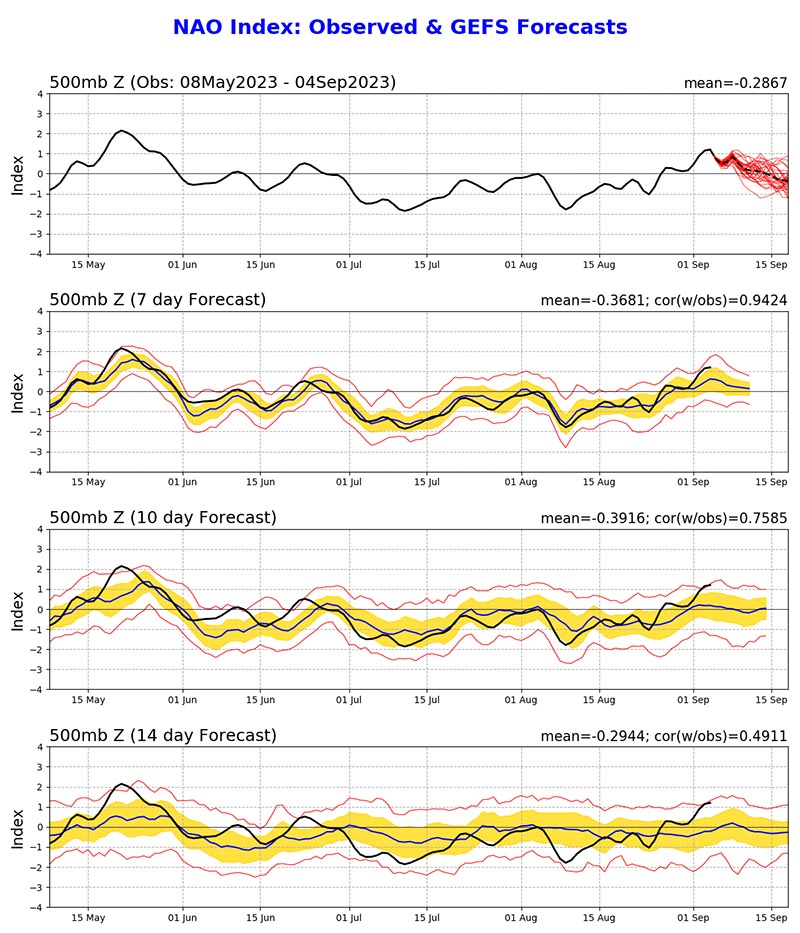
The NAO describes the relationship between air pressure in the Arctic and mid-latitudes where most of us live. Unlike ENSO, the NAO alternates between positive and negative phases on a weekly to monthly basis. The negative phase, characterized by lower pressure and colder polar regions, often results in colder weather and more active winters.
Forecasts for the NAO are difficult to make beyond a few weeks, and its fluctuations have a more substantial impact on the weather in the northeastern United States than ENSO. In conclusion, there’s much uncertainty, but one thing is certain: Mount Washington will experience extreme weather this winter, regardless of what unfolds in the Pacific.
Francis Tarasiewicz, Weather Observer & Education Specialist

