A Look Back at the Feb. 18 Rapid Temperature Drop
2022-02-22 16:21:30.000 – Jay Broccolo, Weather Observer and Meteorologist
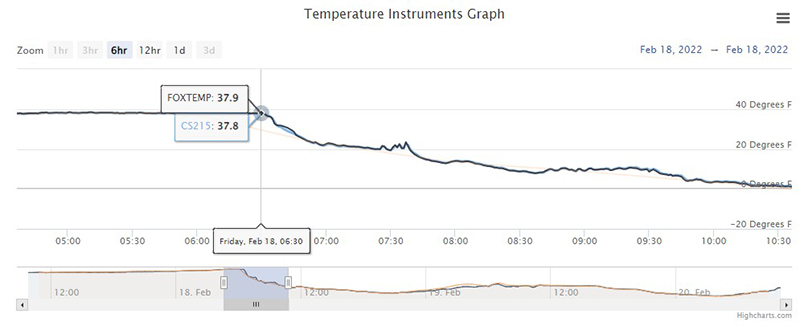
It was like this. The temperature was holding steady at around 38°F on Friday, Feb. 18. The station had just tied the record high temperature for the day. Winds were out of the west/southwest with sustained winds in the 70 to 90 mph range, and it was raining out. The beautiful snowpack that took all winter to build… we watched a lot of it melt away. Jackie had to trudge through a foot or so of slush to get the precipitation can that morning. It was rather messy.
Then, the winds suddenly relaxed and the temperature started to drop. We knew there was going to be a steep decline, given the synoptic set-up. The White Mountains seemed to be at the bottom of the Low’s center as it crossed through the region, which aligned with the bottom of the trough aloft.
As the cold front crossed through, wind direction shifted 20 degrees to the north, making it westerly. It took one hour for the temperature to drop 18 degrees, as seen below in figures 1 and 2.
 Figure 1: Six-hour temperature (°F) at KMWN. Note temperatures at 0630 EST of 38°F.
 Figure 2: Six-hour temperature (°F) at KMWN. Note temperatures at 0730 EST of 19°F.
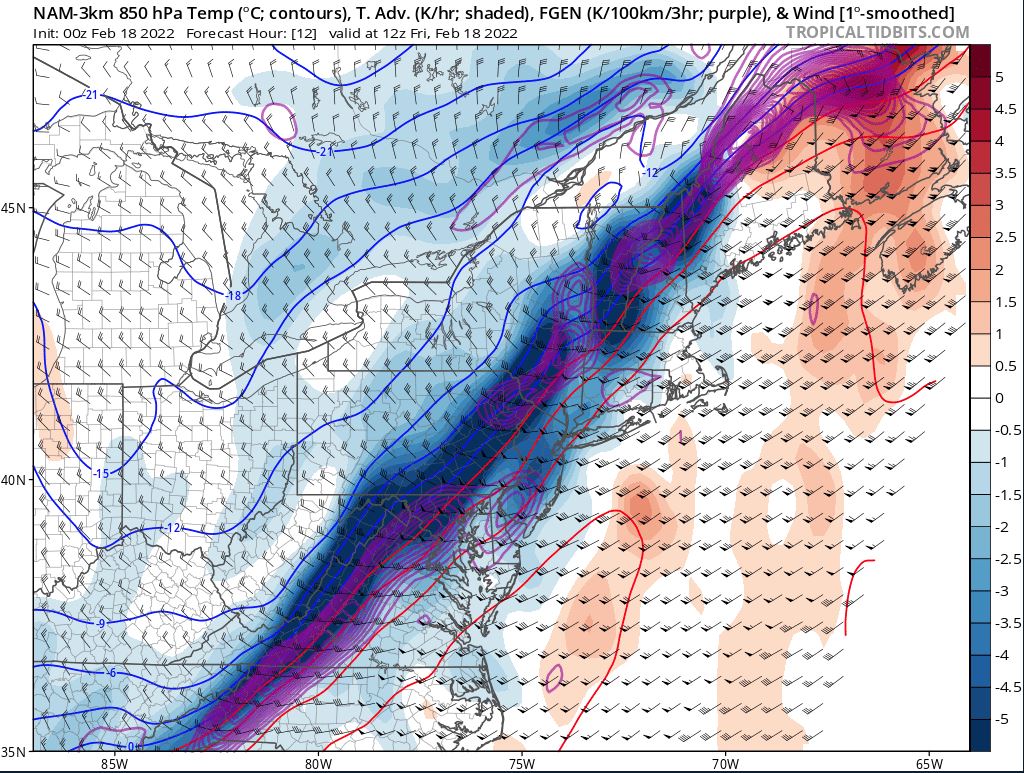
At 0630 EST, the temperature was 38°F (rounded). Over the next hour, the warm front abated, and the pressure bottomed out at roughly 780 hPa, signifying the passage of the trough and that the cold front would be quickly approaching. The night prior, we looked at the weather prediction models to see if our forecast had changed, which it had not really, but we did see that the models were trending towards a stronger cold front. In figure 3, you can see the 00Z model run for that day. The strong cold front and frontogenesis were projected to pass between 0600 and 0700 EST, along with the bottom of the trough as depicted by the wind barbs.
 Figure 3: 2022 02 18-00Z NAM 3K 850-hPa Temperature advection (°K/hr), frontogenesis (°K/100km/3hr) and wind barbs (direction and speed in knots).
The cold front actually began to sweep through, at summit level, at 0631 EST. Around 25 minutes later, the temperature dropped 16°F, then another 2 or 3°F over the next half hour. Figure 4 also shows the intensity of the front. The dark blue color part of the cold front was likely just east of the summit by 0800 EST.
Behind the front, cold air advection was much less and presented as a more gradual slump in temperature rather than the plunge that occurred initially. The weather prediction center also puts out a synoptic surface analysis overlayed on an infrared satellite image. Figure 4 (below) shows the frontal boundaries and surface isobars (lines of equal pressure) from the associated event. Evaluating the isobars and position of the frontal boundary indicates two distinct air masses on either side of the front. Flow tends to follow the isobars and by the looks of this surface analysis, it seems as though the wind shift at the surface was more profound than it was at the summit.
Figure 4 also shows the satellite imagery. The cloud cover and temperature colder cloud top temperatures seen to the east of the front is another indicator of the different air masses.

Figure 4: 2022 02 18-1200Z Surface analysis and infrared satellite imagery.
We constantly watch satellite imagery and radar when precipitation is around to observe what occurs in the atmosphere. It is intriguing to then experience it and follow data from our mesonet, summit instruments, and real-time observations as systems pass through the White Mountains.

Figure 5: Weather Observer and Education Specialist Jackie Bellefontaine’s footprints frozen from refreeze of waterlogged snow.
Until next time…
Jay Broccolo, Weather Observer and Meteorologist


