
An Analysis of Hurricane Dorian So Far
2019-09-02 08:57:45.000 – Ian Bailey, Weather Observer/Education Specialist
This past weekend we had our final Summer Edutrip for the season on the summit. And the theme for this trip, coincidentally, was Hurricanes and the Science of Tropical Cyclones. As such the observers and the trip group were closely following the progression and evolution of Hurricane Dorian. As of early Sunday morning, Hurricane Dorian reached category 5 on the Saffir-Simpson scale, and began to make landfall in the Bahamas with sustained winds around 185 mph. With the catastrophic damage being done and the amount of information flooding the internet about the storm, I felt like I’d write my blog post for this week as an analysis of how the storm came to be as it is currently. I’d like to share the information I know about tropical systems in general, and to give you a brief glimpse into what we discussed about Dorian this past weekend.
Dorian was first identified as a threat back on August 24th by the National Hurricane center, and at the time was merely a tropical depression originating in the south-central portion of the Atlantic Basin. Tropical depressions are essentially an organized cluster of thunderstorms, grouping together into a low pressure system that is building in intensity and showing signs of developing further. Often times, these low pressure depressions fizzle out before becoming a major threat, and the Atlantic Basin sees the formation and dissipation of these weaker systems all the time. It’s only when these depressions progress into more favorable conditions that they can evolve into tropical storms. On the afternoon of the 24th, that’s exactly what happened with what would then be named Tropical Storm Dorian.
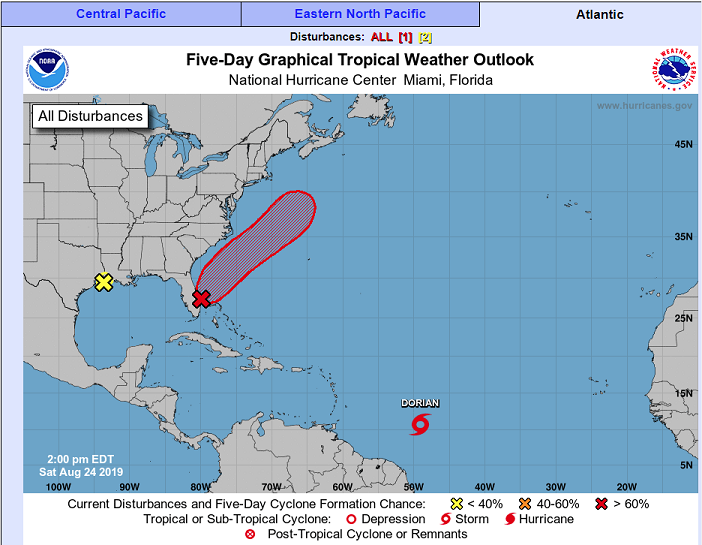
National Hurricane Center graphic and discussion from when Dorian was a Tropical Storm
In order for this evolution from depression to tropical storm to take place, there are several key ingredients that needed to come together:
1. There needs to be warm sea surface temperatures (SSTs) in the path of the system, typically at 80ºF or higher. Generally speaking we’re interested in SSTs of 80 degrees or more, and this warmer water will act as a fuel source to feed the storm along its progression. Across the planet, the sun is heating the surface unevenly, with some areas receiving more incoming solar energy than others. This happens quite frequently along the equator, especially with the oceans absorbing and holding large amounts of that incoming energy. This heating also drives the evaporation process, in which water is transformed into water vapor and lifted into the atmosphere. The processes of evaporation actually draws heat from the surrounding environment into the water vapor, transferring that heat energy into the air above. Once that vapor rises, cools and condenses into clouds, that heat energy is then released into the surrounding environment and, in large quantities, can lead to an unbalanced atmosphere. All types of storms, from your standard afternoon thunderstorm to the largest of hurricanes, are acting as heat engines that are attempting to re-distribute energy throughout the atmosphere evenly, and return it to a balanced state. So when you have warmer SSTs to help accelerate and intensify the energy transfer process, you can create and incredibly unstable atmosphere that builds some impressively powerful storm systems.
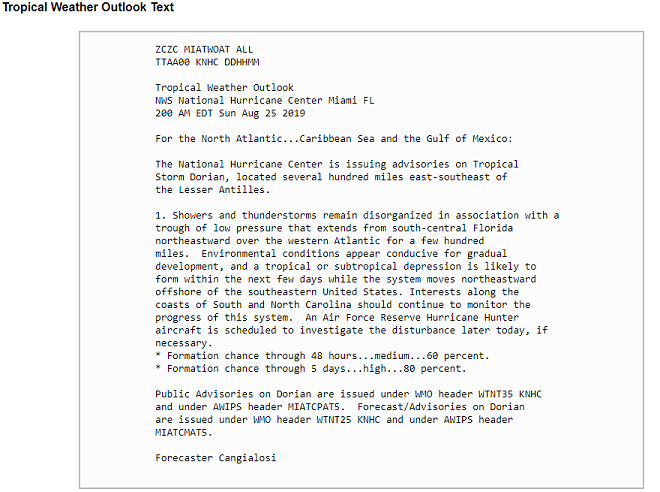
2. You need an environment with very low wind shear. Wind shear, in particular speed shear, is the increase in wind speeds with height. Near the surface where friction from the land is present, you generally have lower wind speeds. Higher up in the atmosphere, above the tress, hills and mountains that would slow this air down, you can have much faster moving winds. When the difference in speed between the surface and aloft is great, we identify this as a high shear environment. Hurricanes progress further through their evolution when the opposite occurs. A high shear environment would, literally, shear the top of the storm system off and destabilize its structure, preventing it from progressing further. However, out over the open ocean particularly, the surface friction is greatly diminished and the difference in wind speeds between the surface and aloft isn’t as profound. This generally allows the storm structure to develop vertically more than normal, which allows for more heat energy to be released into the environment…do you see where this is going?
3. There needs to be unstable atmospheric conditions for the tropical system to progress into. Environments that are already unstable, such as environments with increased amounts of moisture at the mid-levels of the atmosphere, can be ingested into the developing storm as a secondary fuel source. Whether that’s ambient moisture aloft, or a dissipating previous low pressure system, adding extra energy from the environment to the developing storm system will other further enhance its progression. Additionally, a lack of stable environments or shearing winds from blocking high pressure systems can be key. Removing anything that would act to inhibit the storm will, naturally, allow it to prosper.
While this isn’t everything that goes into storm evolution (because trust me, there sure is quite a bit more for us to learn about hurricanes and storms in general that we still don’t know), these are certainly key ingredients that come together to enhance tropical systems. And the Atlantic Basin is a hot spot for these conditions to occur, allowing us to experience the “hurricane seasons” that we do each year. So now that we know what ingredients to look for, let’s take a look and what came together for Dorian to reach where it is now.
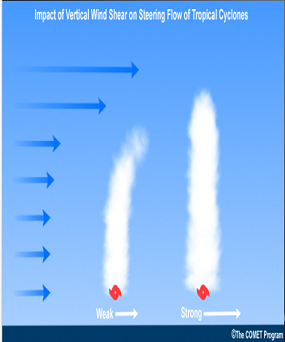
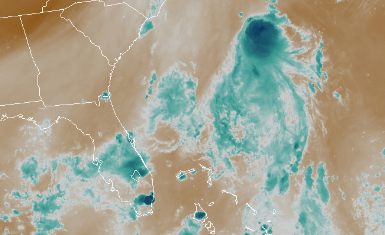
At the time Dorian transformed into a tropical storm, the National Hurricane Center did an analysis of the SSTs in the projected path of the storm. What they found was that Dorian, assuming it followed that path, was set to move into incredibly warm waters. Not the standard 80º F mentioned before, but surface waters ranging between 90º-95ºF. In the image below, you can see just to the Northwest along Dorian’s path a large area of these incredibly warm waters for it to ingest heat energy from.
GOES 16 analysis of Sea Surface Temperatures, with purple indicating temperatures between 90º-95ºF
Additionally, Dorian’s path took it away from most of the landmasses that typically fall into tropical storm paths. While it scraped by the the Lesser Antilles and Puerto Rico as a tropical storm, the Northwest arc of the storm track would take Dorian out into the open ocean. This means Dorian would progress into an environment with much less wind shear, and would be more favorable for vertical development that the friction from landmasses would normally disrupt. At the time this occurred, Dorian did in fact evolve from a Tropical Storm into a Category 1 Hurricane.
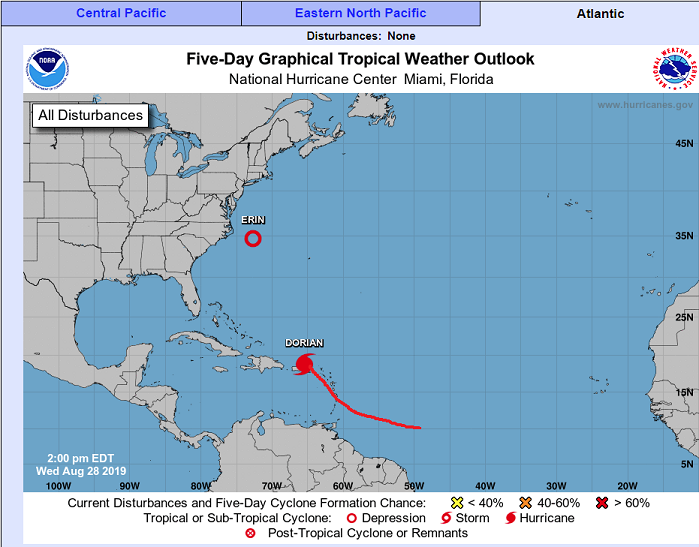
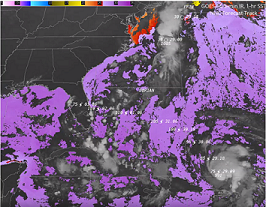
Finally, you may have noticed in the maps from the National Hurricane Center I’ve included so far that there was another tropical system at play in the Atlantic Basin at the same time as Dorian. Tropical Storm Erin, or rather, Tropical Depression Erin at this point in the timeline, was dissipating off the coast of North Carolina. All of the remnant moisture from the decaying storm was dispersing throughout the mid-levels of the atmosphere. A decent chunk of that moisture was beginning to be drawn down towards Dorian as the new storm intensified. Inevitably, this chunk of remnant moisture would be ingested by Dorian out over the open ocean, and act as a secondary fuel source to allow the hurricane to grow further.
As we can now see, quite a considerable amount of the necessary ingredients had come together to help Dorian progress into a major hurricane. And by 5:00 pm on Friday August 30th, 6 days after the onset of the tropical depression, Hurricane Dorian had reached sustained wind speeds of 115 mph, classifying it as a Category 3 Hurricane just East of the Bahamas.
Throughout the timeline to this point and beyond, the National Hurricane Center has been doing a phenomenal job of modeling, tracking and forecasting this Hurricane. I wanted to take a moment to direct you to two of their pages. Nhc.noaa.gov is constantly updated with forecasts, discussion and graphics to help you understand what’s going on with any tropical systems currently, and how the system could play out going forward. They provide the Cone of Influence graphics that encompass all the projected possible paths of the storm, and take the time to explain not only what this means to locations caught in said path, but how to prepare properly in the event the storm impacts your area. Additionally, they are all over social media pages, particularly their own Facebook page, providing constant live broadcast updates of the storm. During these broadcasts they take you inside the NHC and show you what they are seeing in the storm, providing input from multiple scientists working on the storm, and try to answer questions from the public as best they can. As this storm continues to play out, I highly recommend you reference their sites as they contain an abundance of information.
So once Dorian hit Category 3, how did the rest of the weekend play out?
With the blocking Bermuda High Pressure system just to the North, Dorian slowed down quite substantially. Throughout most of Friday afternoon into the day on Saturday, the storm was only moving at about 10mph, and occasionally less than that. As a result, Dorian was able to ingest an incredible amount of moisture and heat energy, and created an excessive build-up of moisture throughout the backside of the storm’s structure. This moisture build up can actually cause a hurricane to wobble quite a bit along its path, and inevitably force one of the central rain bands to strengthen, ingest and take over the eyewall.
This process is known as an eyewall replacement cycle. And initially, this causes the hurricane to weaken a bit. However, what’s actually happening is ingesting of energy from the previous eyewall into an already strengthening new eyewall (previously the central rain band). Once this energy is absorbed and dispersed throughout the system, central rotation of the storm can drastically increase, and as a result the hurricane re-intensifies and gains strength. To my knowledge while following Dorian’s evolution this past weekend, there were 2 eyewall replacement cycles that occurred; one Friday evening into Saturday, and one Saturday night into Sunday. Going back and looking and the NHC graphics from these timeframes, Dorian was experiencing maximum sustained wind speeds at 150 mph by 8:00 am on Saturday (Category 4) and 185 mph by 8:00 am on Sunday (Category 5); all of which happened over the very short distance from where it hit Category 3 and the Bahamas.
Unfortunately, the second eyewall replacement cycle which likely pushed Dorian into Category 5 status happened on Sunday morning, right before the storm made landfall on the Abaco Islands in the Bahamas (which brings us to the time of this writing). Already social media has been flooded with horrifying images/videos of catastrophic wind and flood damage from the storm. With wind gusts reported as high as 220 mph, and storm surge/swell reports cresting over 20 ft, it’s really hard to image how much could survive the wrath of a storm like this. We’ve certainly been keeping all of those in the path of the storm in our thoughts, and are hoping that people are staying as safe as they can in light of this devastating tropical system.
Thank you all for reading this far and sticking with it. This is my analysis of Hurricane Dorian thusfar, and I’ll certainly be following it through the remainder of its lifecycle. And again, you should definitely check out the National Hurricane Center website, as well as their Facebook page and social media outlets for more information as the storm progresses. Until next time, thanks everyone! And stay safe!
Ian Bailey, Weather Observer/Education Specialist

Seek the Peak Spotlight: The Cloud Chasers
Seek the Peak Spotlight: The Cloud Chasers By MWOBS Staff Mike Bergeron and Desiree Bolton have been participating and volunteering for Seek the Peak for three years now. Together, they comprise Team Cloud Chasers
Celebrating 250 Years: The Declaration’s Legacy in the White Mountains
Celebrating 250 Years: The Declaration's Legacy in the White Mountains By Peter Crane We are now approaching July Fourth, Independence Day, the day when we celebrate the adoption of the Declaration of Independence in

Seek the Peak Spotlight: Ryan Shepard
Seek the Peak Spotlight: Ryan Shepard By MWOBS Staff Before Ryan Shepard moved to Conway, he was in Western New York celebrating his 40th birthday party. “I wanted to go big,” he said. “Big”
