
Indoor vs Outdoor Pressure
2011-09-05 17:32:27.000 – Ryan Knapp, Weather Observer/Meteorologist

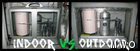
Pressured fight: Indoor vs Outdoor Barometer
As Roger mentioned a few days ago, I was originally going to talk a bit about Hurricane Irene. But as I looked through our comments and everything else that is available, I just couldn’t find anything new that hasn’t already been said. Mike Carmon’s comments before, during and after Irene did an excellent job in summarizing all that needed to be said for up here in my opinion. And Roger took the last piece of Irene I was going to talk about: pressure. And while Roger did a great job in explaining one method we use in measuring pressure, I thought I would add a bit more and explain why we have two nearly identical barometers measuring pressure; one for indoor pressure and one for outdoor pressure.
Now, on most days in the summer, the two barometric pressure trends look nearly identical if not completely identical. The winds are low, the temperatures indoors and outdoors are nearly even, and with almost every available window and door wide open to try and get some circulation, the pressures are fairly even. But as the weather starts to turn, the differences in pressure can start to be seen and felt. In large storms, like Irene or any one of several we experience in the winter, the winds start to increase, the temperature differences inside and outside start to become greater, and the building becomes as sealed up as we can get it. As a result, the ‘stack effect’ increases and doors become harder to open and close, breezes of warm and cold air can be felt from open cracks around the building, ears start popping any time a door heading outside is open or closed, and most notably, our two barographs start to diverge in their tendencies.
To relay what I mean, we’ll examine the last eight days in August. And since a picture is worth 1000 words, that’s what I will use. Like Roger mentioned in his comment, our barometers work on a four day drum. So to get 8 days’ worth of trends, I had to stitch two charts together via Photoshop. While I was happy with the stitch the stitch I did for Rogers comment on the 2nd, to compare the two barometers for todays comment, this method wasn’t completely working out. In his picture, I used my camera and then stitched his image together but when I started to do overlays with the various images, the sizing, angles, colors, etc. were all off making things hard to even remotely line up. So after doing monthly check and scanning the charts in, within a matter of seconds I had the clean images I wanted.
So in this first image (FYI, click on the highlighted and underlined word for the image) you can see our indoor barograph. Note how smooth the line is since the pressure changes are not as affected by the winds outside. The next image is our outdoor barograph. The lines are a bit more jagged and thicker since it is influenced by the winds. You will also note markings on this graph as we note any time the pitot anemometer gets clogged with water, vanes improperly, etc. and we also note the differences in its recordings compared to that of our digital barometer. When we put them side by side, they look nearly identical but when we overlay them, you can really see their differences (the outdoor trend is black and the indoor trends are blue). When winds are calmer, you can see the trends starting to converge but as the winds increase and we start closing up doors and windows, the lines diverge with the most dramatic divergence occurring during Irene’s passing (the dip in the center of the chart). And while impressive and neat to look at, winter trends tend to be even more dramatic. So at some point this winter, I’ll try to come back to this comparison and show how different the charts look during cold and windy events.
Ryan Knapp, Weather Observer/Meteorologist
From Florida Heat to the Rockpile
From Florida Heat to the Rockpile By Alek Libby Hi everyone! My name is Alek Libby, and I am one of the summit interns here at Mount Washington Observatory this summer! I recently graduated
Summit Summer
Summit Summer By Aspen M. Hello everyone! My name is Aspen, I’m one of the summer weather interns here at the Mount Washington Observatory. I fell in love with weather at a young age
From the Sunshine State to the Home of the World’s Weather
From the Sunshine State to the Home of the World's Weather By Kristen Mihalcik Hello Everyone! My name is Kristen Mihalcik, and I’m one of the Summer interns here at Mount Washington. Enjoying
