
Inside the Weather Room: How Mount Washington Observers Monitor the Atmosphere
By Karl Philippoff
As a weather observer on Mount Washington, we take our hourly observations on the observation deck, usually heading out between :40 to :45 past the hour and then submitting them once we come back down into the weather room. But our job does not end there when we are on observation duty— which you may have noticed during tours of the weather room. As shown below, we usually have at least the two top monitors monitoring current local and regional weather conditions in order to assist us with our observations.
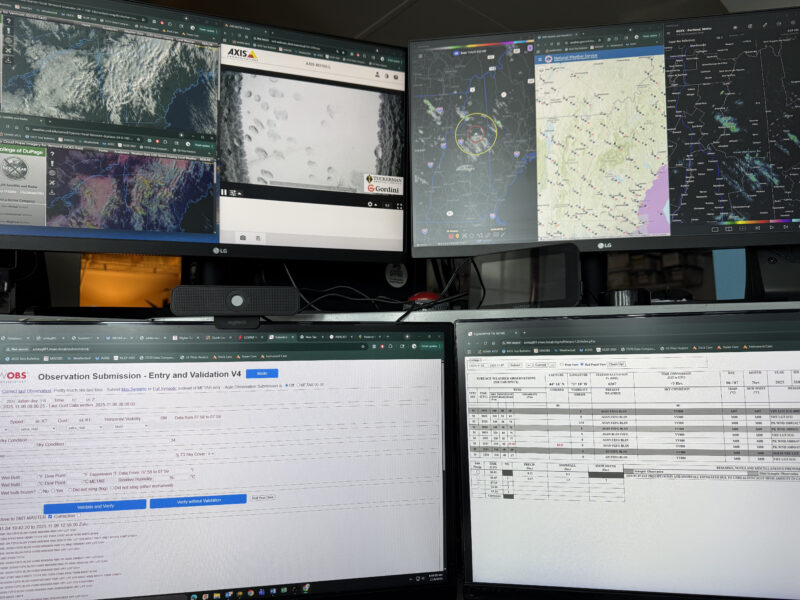
So, let’s take a tour of those two top screens.
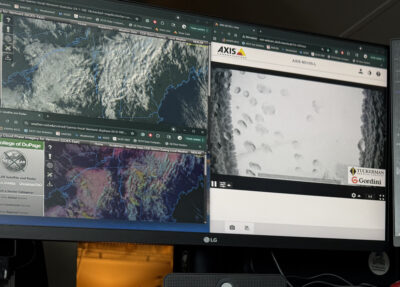
On the top-left screen, I am usually looking at true-color visible satellite, at least during the day, with it typically running on a loop. This gives me a bird’s eye view of how clouds are actively forming in and around New England. The visible satellite can also be useful for determining how much the White Mountains are actively disturbing and deflecting the low-level flow. When clouds are nearly at or below summit level, the windward side of the mountains can be nearly fully cloud covered while the leeward side can be nearly cloud-free. If the cloud layer is well-above the summits, there usually is not as much of a distinction between the windward and leeward sides.
Looking at visible satellite loops can serve as a clue to diagnose lenticular cloud formation. Lenticular clouds appear to remain in place even as air passes through them, similar to how water rapids remain in place as water flows through them. If these wave-like features are seen on satellite images, it can serve as something to look out for during our hourly observations. Lenticular clouds are important to note in our observations because they serve as markers for atmospheric turbulence, and therefore places for aircraft to avoid. Also, it’s just beautiful to watch the clouds spread over or develop over the Adirondacks, Greens, and Whites as low pressure systems move through or during the course of the day. Below it is another satellite image displaying the ‘day cloud phase’, with the different colors referring to the water phase of the cloud top. These could be either water (blue color), ice (red color), or a mixture of the two (green color). This can also serve as rough check of the height of clouds we are seeing, with the different colors corresponding, roughly, to low-level (blue), mid-level (green), and high-level clouds (red). During the summer, both of these views are useful for determining the development of local convection and thunderstorms. This shows up particularly colorfully on the day cloud phase view as the cloud tops transition from low-level clouds composed mostly of liquid water (blue) to much higher clouds made of ice crystals (red) as they ascend to the top of the troposphere and flatten out to become cumulonimbus clouds.
Zooming down from the satellite view, I also usually have a live view of the observation deck camera to keep track of the weather conditions over the course of the hour. This is especially true for fog, as we have to keep track of whether we are fully in the fog, partially in the fog, and the transition between these types not only at the time of our observations, but also between observations. The deck cam can also be useful for diagnosing lenticulars, as it is looking eastward, opposite the direction of our prevailing westerly to northwesterly winds. If lens-shaped clouds appear to remain more or less in place within the view of the camera, that would be a fairly good indication that they are, in fact, lenticular clouds and should be coded in our remarks. The deck camera also has a good view of the Wildcat/Moriah Range and of sunrise when the summit is not in the fog.
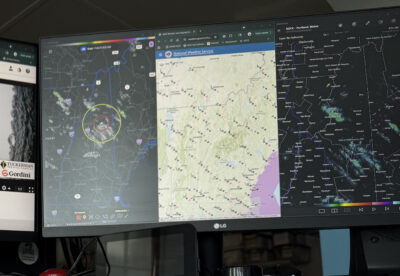 The top right monitor, pictured left, is usually tracking two flavors of radar and the current conditions measured by stations around the area. Radar is an extremely useful tool for monitoring precipitation in our local and regional area. The radar to the left is a regional mosaic that incorporates radar retrievals at different locations and different levels, compiling them into a composite image. The bullseyes on the screen are helpful for indicating how distant showers, precipitation, or lightning are from the summit, with the red circle signifying a range of 10 miles and the yellow circle signifying a range of 25 miles.
The middle screen shows the current conditions as measured at nearby surface stations. Nearby airport stations that have ceilometers can serve as a check for the cloud heights we code in observations, and also serve to illustrate the passage of fronts, winds, and the formation of valley fog at night and into the morning.
The radar image to the right is from RadarScope and is a bit more sensitive than the regional radar composite, but it can only display images from a single radar station at a time. It is usually set to the closest radar station located in Gray, ME, about 60 miles to the southeast. However, the radar beam at its lowest level is partially blocked by portions of the White Mountains, and so does not typically show low-level precipitation to our west and northwest well. In fact, the northern Connecticut Valley and parts of the Northeast Kingdom in Vermont have some of the worst radar coverage in the Eastern United States! Both of these radar systems can be used to check when precipitation may have begun or ended in between our observations, as well as its changes in intensity.
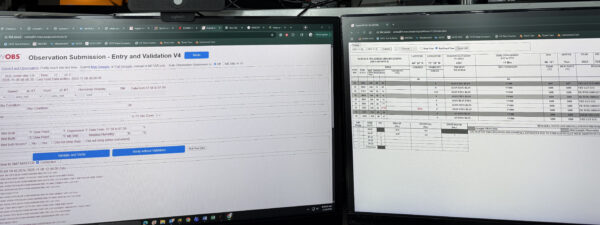
Finally, the lower two screens show how we keep track of our daily observations that we submit to the National Weather Service, and the submission page on which we enter all the data that we collect in the course of our hourly observations. This includes data on temperatures, low-level moisture, winds, and any notable weather (i.e. precipitation, fog) at the summit, or at some distance from the summit, depending on our visibility.
 These are the maps and graphics that I most use when on weather observing duties, with each observer paying attention to a slightly different selection of current conditions depending on what they feel is most relevant to keep track of the current weather situation, and what they have used in the past. How do you keep track of the weather on a day to day basis? How does your routine differ when significant weather events are expected to occur in your region?
Meet MWOBS/MWAC Intern Ryan Tanski
Meet MWOBS/MWAC Intern Ryan Tanski By Ryan Tanski Hello! I’m Ryan Tanski and I’m the joint USFS Mount Washington Avalanche Center and Mount Washington Observatory Intern this winter. I’m thrilled to get to work

Geologist Climbs Rock Pile, Looks Up
Geologist Climbs Rock Pile, Looks Up By Bailey Nordin Hello from the summit of Mount Washington! My name is Bailey Nordin, and I am the newest Weather Observer and Education Specialist joining the team
Life on Top of New England
Life on Top of New England By Anna Trujillo Hi everyone! My name is Anna Trujillo and I am one of the interns for the MWOBS winter season. I am super excited for the
