
It’s Cooler at the Top
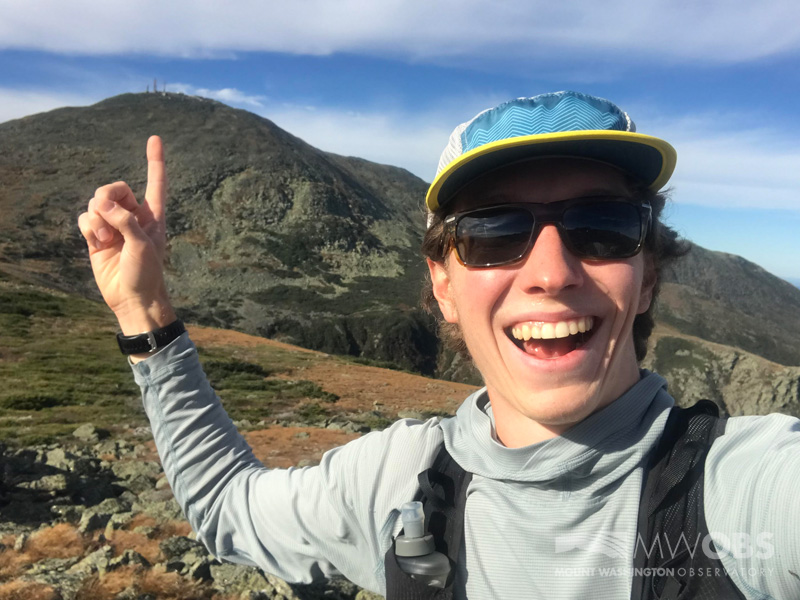
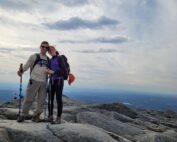
Capturing the moment while doing field research below Mount Washington.
There’s a lot that goes on at the summit of Mount Washington. As many know, one of Mount Washington Observatory’s core priorities is to observe the weather. Observers take an observation every single hour of the day, adding to our 90-year (and counting!) climate record and sharing our data to improve weather models for meteorologists, pilots, climbers, researchers, weather enthusiasts, and other communities.
As the fall intern, I’ve been able to participate in this work, and have also learned how to write the twice-daily Higher Summits Forecast. Coming from a geoscience background, it’s been really exciting to grow as a weather forecaster and to see the parallels in weather forecasting and geologic interpretations: with the former, I synthesize across a variety of data sources to predict what the weather will be in the future, whereas with the latter, I use an assortment of clues left behind by Earth’s geologic processes to postulate what the landscape may have been like in the past.
I also thoroughly enjoyed giving Observatory members tours of the weather station during the warmer months, helping our supporters understand the factors that shape our weather and learn about our instrumentation and observations, and letting kids hold the large mallets we use to de-ice the tower.
However, as I look back on this fall in my final week atop the Rockpile, one of the things I’ve most enjoyed was tackling an Observatory research project.
The Observatory undertakes a variety of research projects, utilizing our location, data, and skills to advance understanding of the natural systems that create Earth’s weather and climate. I am currently working on a project studying the seasonal near-surface lapse rate (NSLR) in the White Mountains – a continuation of summer intern Henry Moskovitz’s work.
Simply put, the NSLR is the rate at which air temperature at the ground (as opposed to, say, 1000 feet in the air) changes with elevation. Accurately understanding how the temperature changes with elevation is valuable for a variety of applications, from our own in-house forecasting to academic studies in the region. For example, a more rapid change in temperature may lead to more thunderstorms forming, and the NSLR can also play a big role in forecasting where the transition may be between rain and snow during precipitation events. From a broader perspective, having an accurate NSLR can help researchers better understand processes such as snowmelt or shifting habitat ranges in the White Mountains.

An accurate near-surface lapse rate can help hikers better anticipate where they may encounter icy trails, like this frozen stretch of the Crawford Path on Oct. 28.
Currently, there is no NSLR known specifically for the Whites. Instead, weather models and scientists use the environmental lapse rate (ELR). This value, -6.5 °C/km or -3.5 °F/1,000 feet (meaning temperature decreases on average 3.5 °F per 1,000 feet in altitude gain) is an average of lapse rates across the globe, and thus not necessarily representative of any one mountain range or climate. While using the ELR is better than nothing, knowing what the specific NSLR is for the White Mountains will help improve our answers to questions like those mentioned above. Subsequently breaking the NSLR down by season can further improve the accuracy of such products, since seasonality is so influential in White Mountain weather.
Our Mount Washington Regional Mesonet is the ideal tool to use to uncover seasonal NSLRs in the White Mountains. The mesonet is a series of 17 remote weather stations (plus the staffed summit station) located across the region on different aspects and at different elevations. All of these stations record temperature, and several also include an anemometer to track wind speeds. For my project, I am analyzing data from the subset of these mesonet stations located along the Mount Washington Auto Road. Including the summit station, there are six stations along this vertical transect, all within a very similar geographic range, increasing the likelihood that they are experiencing similar weather systems at the same time. By analyzing data from these stations, broken down by season, we are able to vastly improve our understanding of seasonal NSLR in the White Mountains.
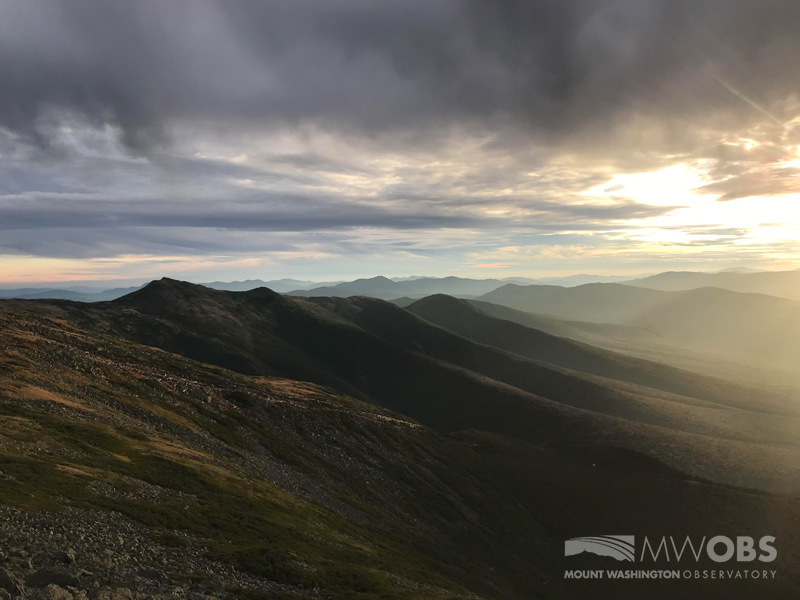
A Halloween sunset casts a beautiful glow over the Southern Presidential range.
Much of my fall has entailed developing a Python script to analyze the data from these stations. Python is a coding language which can make analysis of large datasets much easier and more efficient than other methods, such as using Excel, and which is widely used in the scientific community. While some people find this sort of work infuriating, I actually think coding can be fun – it’s like continually solving puzzles for science! While more complicated, this script essentially takes in a year’s worth of raw data from these six sites, removes any bad data (e.g. an anomalous temperature of 999°F or a day that one site didn’t record temperatures), calculates the NSLR for each day, then averages those daily NSLRs by season to get a seasonal NSLR for the White Mountains.
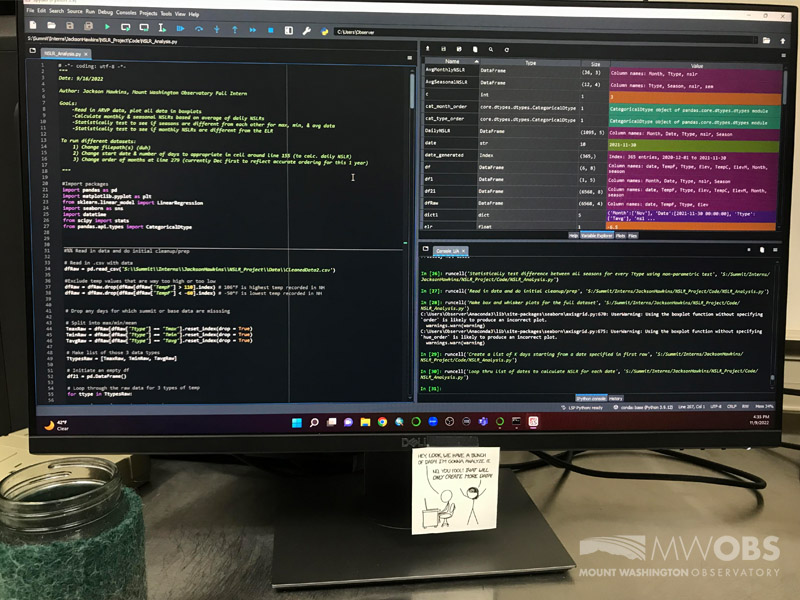
Two fixtures of my summit internship: Python workspace (for analyzing the Observatory’s temperature dataset) and my jar of tea.
Ultimately, we aim to analyze 30 years’ worth of data, as this would constitute a full climatology – a period of time taken to represent the climatic normals of a region – to get the most accurate NSLRs possible for the White Mountains.
I’m still wrapping up the analysis on this project, now focusing on statistical differences between seasons and between each season and the ELR. Running statistics helps us understand if there’s an actual (i.e. significant) difference between two values, or if variation between two values is simply due to random variability in the data. This is particularly key for this project, as it’s ultimately very important to show that the seasonal NSLRs I calculate for the Whites are, in fact, different from the global average ELR. While I don’t have results ready to share just yet, I can share that it’s looking like most seasons have an NSLR that is statistically significantly different from the ELR. We look forward to sharing final results!
When I interviewed for this internship, I expressed that I wanted to work at the Observatory to do science that is directly relevant to society. From writing Higher Summits Forecasts to researching the near-surface lapse rate in the White Mountains, I’ve been delighted to apply my skills to do just that. It’s been particularly fun to be a part of the research going on here at the summit, helping to answer questions that will improve the quality of regional forecasts and ripple out to improve science in the Whites.
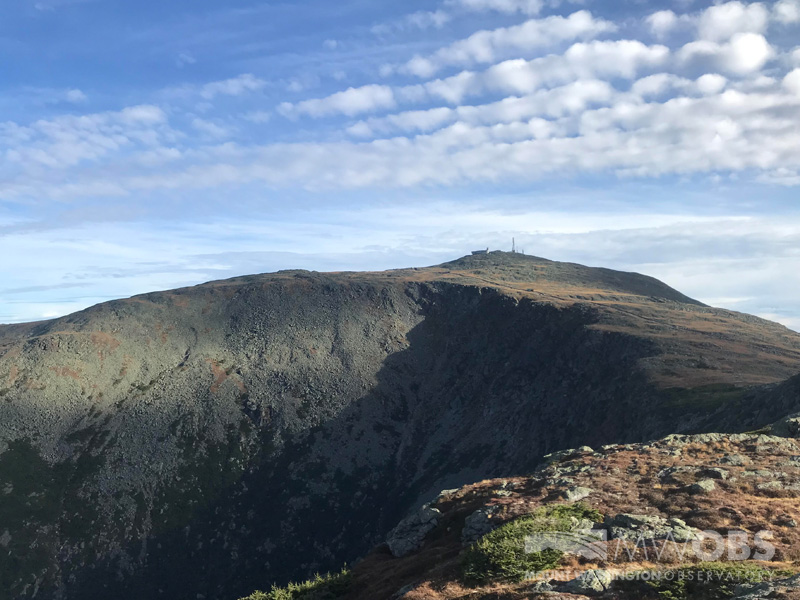
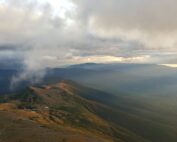
The Mount Washington summit as seen across the Great Gulf from Mt. Clay on Oct. 4. You can see why they call it the Rockpile.
I’ve also enjoyed meeting a wide variety of people while giving weather station tours and, of course, spending a fall at the top of New England! While this peak may be the Home of the World’s Worst Weather, it has also felt like a home for me over the last months, and I’ll certainly be sad to head down the Auto Road one last time this week.
It’s gratifying to know that some of my efforts will be incorporated into the Observatory’s work in the future. And who knows? Maybe one of those children posing with a de-icing mallet atop the tower will be in my shoes a few years down the line.
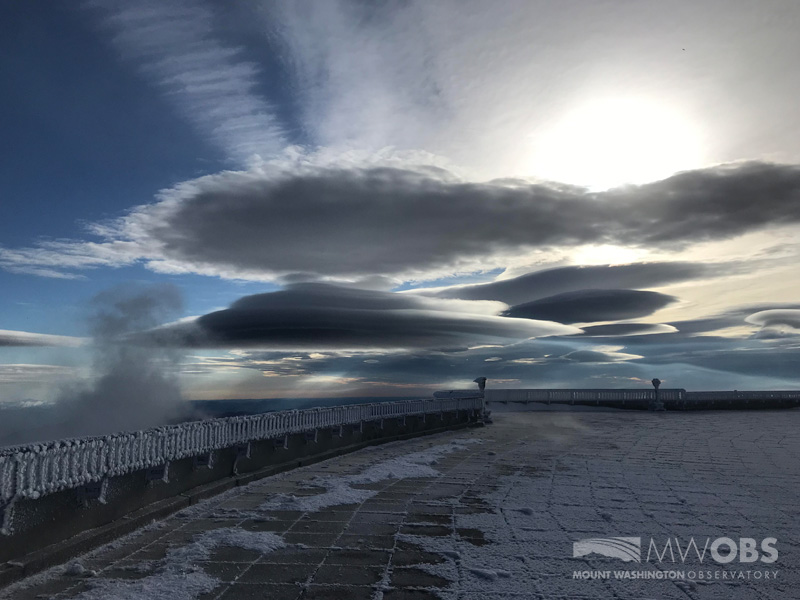
Rime ice and lenticular clouds (my favorite type) make for quite the view across the observation deck on Sept. 16.
Jackson Hawkins, Summit Intern
Seek the Peak Spotlight: The Cloud Chasers
Seek the Peak Spotlight: The Cloud Chasers By MWOBS Staff Mike Bergeron and Desiree Bolton have been participating and volunteering for Seek the Peak for three years now. Together, they comprise Team Cloud Chasers
Celebrating 250 Years: The Declaration’s Legacy in the White Mountains
Celebrating 250 Years: The Declaration's Legacy in the White Mountains By Peter Crane We are now approaching July Fourth, Independence Day, the day when we celebrate the adoption of the Declaration of Independence in
Seek the Peak Spotlight: Ryan Shepard
Seek the Peak Spotlight: Ryan Shepard By MWOBS Staff Before Ryan Shepard moved to Conway, he was in Western New York celebrating his 40th birthday party. “I wanted to go big,” he said. “Big”
