
New Normals Reveal Valley and Summit Temperature Increases, Among Other Climate Trends
By Brian Fitzgerald, Director of Science & Education | November 15, 2021
Chances are, you’ve heard a meteorologist refer to weather conditions as near, above, or below “normal.”
But just what is normal for where you live? Who gets to say? How is it even determined?
Every 10 years, the National Centers for Environmental Information [(NCEI) formerly known as the National Climatic Data Center] are charged with generating climate statistics known as U.S. Climate Normals, based on requirements from the World Meteorological Organization (WMO) and National Weather Service (NWS).
These statistics are calculated for thousands of locations throughout the country, across a uniform 30-year period, and serve as a baseline to compare against weather forecasts just like the one you might have seen today. Statistics such as daily, monthly, seasonal, and annual averages of temperature, precipitation and other climate variables are computed for roughly 15,000 stations nationwide, including the summit of Mount Washington based on weather data transmitted from Mount Washington Observatory (MWO) staff. With the anticipated release of the new normals in late spring 2021, MWO staff naturally wondered: what has changed?
As countless investigations such as the US National Climate and IPCC assessment reports have shown, a warming planet has led to climate changes throughout the entire globe, with regionally specific trends. Changes unique to Mount Washington, as shown by Murray et al. (2021, “Climate Trends on the Highest Peak of the Northeast: Mount Washington, NH”) include elevation-dependent warming rates over many decades. With this in mind, many were curious: What if any evidence of climate change could be seen by comparing the 1981-2010 and 1991-2020 climate normals, even though these two datasets have 20 over-lapping years between them.
To help us answer some of these questions, our summit interns, with guidance from NH State Climatologist Mary Stampone (a MWO trustee) and myself, took on the investigation this past summer to help us understand not only what may have changed on the summit (KMWN, 6,288 ft.), but also up and down the Mount Washington Valley at sites including Pinkham Notch Visitor Center (GHMN3, 2,025 ft.) and North Conway Village (NCON3, 522 ft.). As the interns began to compare each station’s 1991-2020 climate normals set versus the older 1981-2010 set, three broader stories began to appear:
An increase in annual average temperature, with variation among the three sites.
As shown in the data table below, all three sites saw annual average temperatures increase in the new normals, with North Conway showing evidence of warming every single month of the year. All told, the annual average temperature at North Conway is +1.6F degrees warmer than the previous set of normals. Mount Washington’s annual average temperature warmed +0.7F degrees, while Pinkham Notch saw a nearly even split between months that warmed or cooled in comparison, making an annual average temperature that warmed just +0.2F degrees.
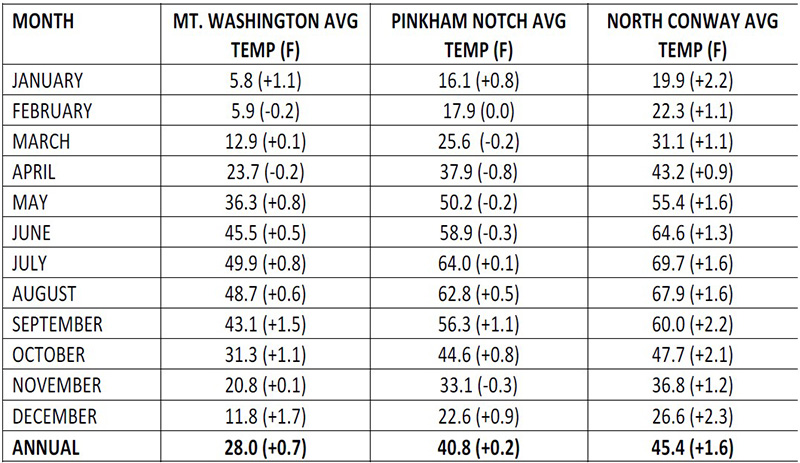
Table 1. Mean average monthly and annual temperatures for KMWN, GHMN3, and NCON3, New Hampshire, for 1991-2020 (with comparison to the prior 1981-2010 normals).
An increase in annual average snowfall, particularly later in the season.
When comparing the three sites and their relative changes in annual snowfall, Pinkham Notch surprisingly saw the largest increase for total snowfall. Among the sites, Mount Washington now averages 281.8 inches annually, with Pinkham averaging 135.8 inches, and North Conway 84.0 inches. Pinkham’s increase to 135.8 inches annually is now 9.7 inches higher than in the previous normals, versus 4.0 inches more in North Conway and just 0.6 inches more on the summit of Mount Washington.
In addition to the variations among the three sites, it was notable that within the snow season, all three stations saw an overall increase in snowfall in February (see Figure 1.). This increase across the board slightly later in the snow season is worthy of a closer look to understand how the nature of our winters are changing, and what the impacts may be to the region’s snow packs.
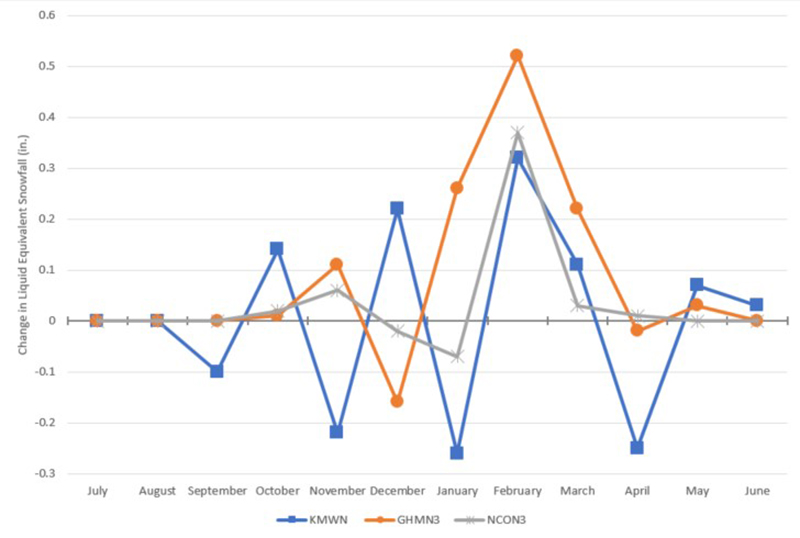
Figure 1. Change in liquid equivalent snowfall at KMWN, GHMN3, and NCON3 between the 1981-2010 and 1991-2020 climate normals.
Changes in precipitation varied drastically among the three stations.
Finally, when comparing the three stations’ new precipitation normals versus the prior set, fairly noticeable variation throughout the year, and from station to station, seems to appear. Overall, precipitation dipped more than five inches annually on average at Mount Washington, while Pinkham Notch gained almost five inches, and North Conway saw a marginal annual increase of 0.5 inches (see Figure 2.).
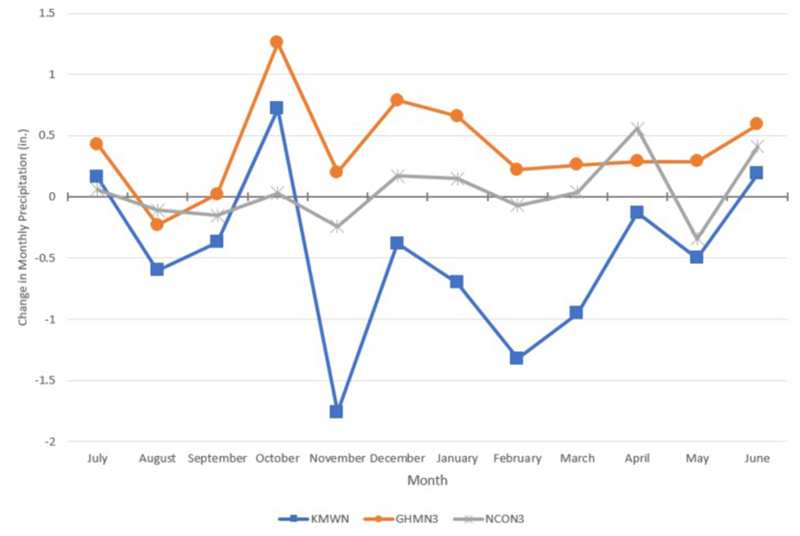
Figure 2. Change in precipitation at KMWN, GHMN3, and NCON3 between the 1981-2010 and 1991-2020 climate normals.
One area of consistency among the three stations appeared in October, where a general increase in average precipitation totals was observed. From a meteorological perspective, the team was unable to complete a forensic investigation of particular storms or weather patterns in the 2011-2020 timespan that may have accounted for this increase; however, best guesses at this stage may point to an increase in the intensity or perhaps even frequency of extreme precipitation events from coastal, bomb-cyclone type nor’easters.
All together, the investigation comparing the new climate normals versus the prior set across the Mount Washington Valley has uncovered some broad-based differences and a number of lingering questions. Future investigations into these datasets could shed light on precisely what, if any, shifts in the snow season may be occurring, and how such changes may differ across a variety of mountainous terrain and elevation.
Although this investigation was a comparison of two largely overlapping datasets, versus an analysis of longer-term climatological data, the research conducted by our summit interns has given MWO a clearer understanding of what our “new normal” on the summit of Mount Washington is. If you’re curious to learn what your “normal” weather is in your backyard, we encourage you to visit ncei.noaa.gov to search for climate normals near your town. Additionally, to learn more about MWO’s recent climate normals project and read the summary report, visit mountwashington.org/research.
MWO Observers Jay Broccolo and Sam Robinson, and MWO summer interns Alexandra Branton, Michael Brown, Madeline DeGroot, and AJ Mastrangelo contributed to this story.
Seek the Peak Spotlight: The Cloud Chasers
Seek the Peak Spotlight: The Cloud Chasers By MWOBS Staff Mike Bergeron and Desiree Bolton have been participating and volunteering for Seek the Peak for three years now. Together, they comprise Team Cloud Chasers
Celebrating 250 Years: The Declaration’s Legacy in the White Mountains
Celebrating 250 Years: The Declaration's Legacy in the White Mountains By Peter Crane We are now approaching July Fourth, Independence Day, the day when we celebrate the adoption of the Declaration of Independence in

Seek the Peak Spotlight: Ryan Shepard
Seek the Peak Spotlight: Ryan Shepard By MWOBS Staff Before Ryan Shepard moved to Conway, he was in Western New York celebrating his 40th birthday party. “I wanted to go big,” he said. “Big”
