One Windy Day
2018-04-05 14:20:11.000 – Tom Padham, Weather Observer/Education Specialist
Although not quite the storm I was hoping for, the storm that has affected the summit over the past 24 hours has still been very impressive due to the duration of our high winds. For 10 hours straight we observed winds equivalent to a category 3 hurricane (111 mph or greater), with 16 consecutive hours of 100 mph or greater winds. Despite the long duration of winds of this magnitude, our peak gust from the storm was “only” 120 mph, meaning these were extremely steady, but very strong winds. We’ll take a look below at the overall set up for this storm, why we were so excited for high wind potential, and one theory as to why the summit did not see higher winds.
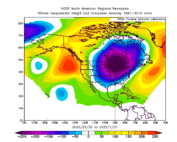
It was anticipated that the highest winds with this storm would occur on the tail end of the system, as high pressure situated over the Southern Appalachians began building into New England from the southwest.
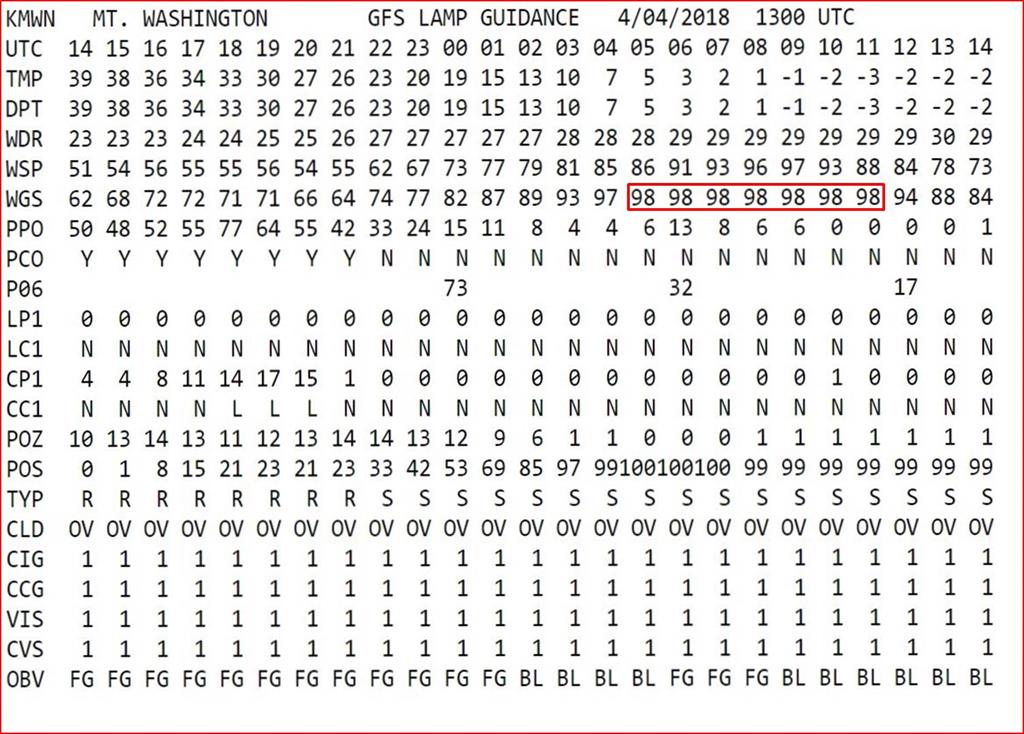
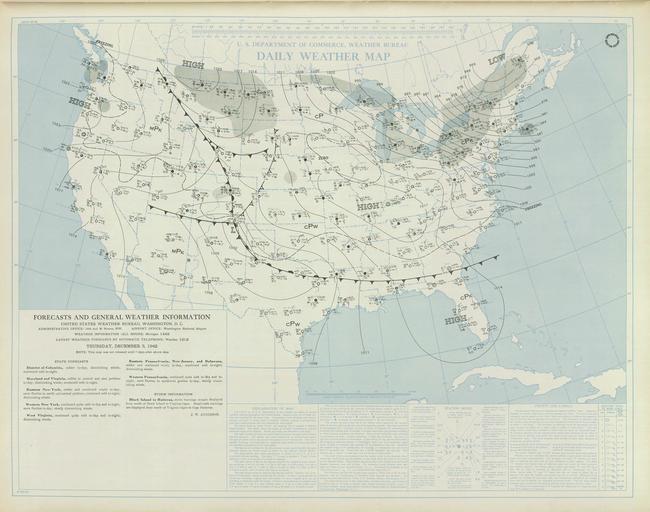
A very tight pressure gradient between the strong storm system that tracked through the Saint Lawrence Valley and this high pressure set the stage for widespread high winds across New England. This type of set up has resulted in some of the highest wind events ever recorded on the summit (gusts of 154 mph in 1996 and 175 mph in 1942 come to mind, to name a few), but for a system to produce winds of that caliber, a few other factors need to align. Firstly, the location of the high pressure is extremely critical to the strength of the winds (by setting up the steep pressure gradient between the passing Low and the building High pressure systems). Additionally, the atmospheric profile must show a few key elements as well.
Tom Padham, Weather Observer/Education Specialist
Going with the Flow: Why New England Didn’t Experience Any Classic Nor’easters This Winter
Going with the Flow: Why New England Didn’t Experience Any Classic Nor’easters This Winter By Peter Edwards Why didn’t the Northeast experience any major snowstorms this year? If I had to guess, it’s the
A Look at The Big Wind and Measuring Extreme Winds At Mount Washington
A Look at The Big Wind and Measuring Extreme Winds at Mount Washington By Alexis George Ninety-one years ago on April 12th, Mount Washington Observatory recorded a world-record wind speed of 231 mph. While
MWOBS Weather Forecasts Expand Beyond the Higher Summits
MWOBS Weather Forecasts Expand Beyond the Higher Summits By Alex Branton One of the most utilized products provided by Mount Washington Observatory is the Higher Summits Forecast. This 48-hour forecast is written by MWOBS

