
AIRMAP
The primary mission of AIRMAP , which was based at the University of New Hampshire’s Climate Change Research Center, was to develop a detailed understanding of climate variability and the source of persistent air pollutants in New England, to identify the causes of climate variability, predict air quality changes as an addition to daily weather forecasts, and to demonstrate new forecasting technologies. AIRMAP was supported by NOAA’s Office of Oceanic and Atmospheric Research.
The Observatory made several contributions to AIRMAP:
- The summit crew monitored the Mount Washington AIRMAP air quality measurement instrumentation.
- Our staff scientists published studies of summertime ozone, multi-year aerosol ionic composition variations, aerosol acidity, and unusual winter aerosol composition events.
- We analyzed the summit climate record for evidence of trends. We have digitized Mount Washington hourly and six-hourly climate data, with a continuous record starting in 1935. These data provide better temporal resolution than the daily summary data that are available from the National Climate Data Center.
To date the analysis has focused on long term trends in temperature and humidity. These data sets are unique due to both their long record length and consistent instrumentation. Most U.S. weather and climate stations have changed instruments or location within the last 70 years.
An analysis of the 1935-2003 temperature data (Grant et al. 2005, 2009) showed a warming of 0.05ºC per decade (0.08ºF per decade) in annual average temperature. During this 69 year period the winter and spring average temperatures warmed more than the annual average, 0.10ºC per decade (0.18ºF per decade) and 0.12ºC per decade (0.21ºF per decade) respectively. Summer and fall had weak negative trends. The difference between daily minimum and maximum temperatures has decreased in summer during this period by -0.07ºC per decade (0.12ºF per decade), the only seasonal statistically significant trend (Figure 1). Overall, these warming trends are slower than stations across the Northeastern US.
FIGURE 1. ANNUAL AND DIURNAL TIMESERIES
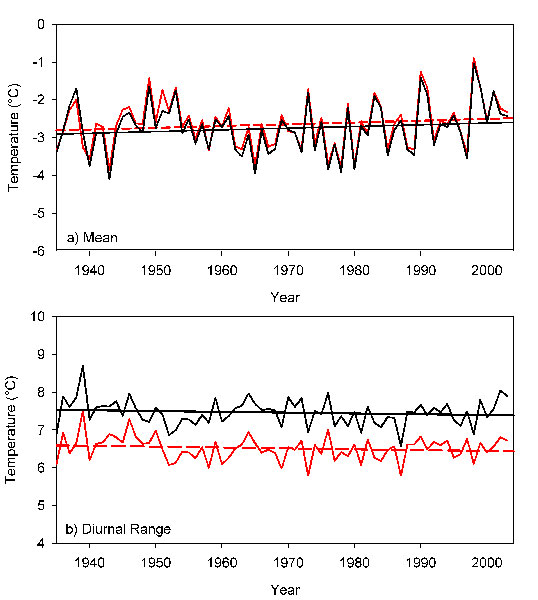 (a) Mean temperature and (b) diurnal temperature range, with linear regressions, for the 69-yr record from max/min (black) and hourly (red) datasets. Max/min (hourly) mean temperature has increased by 0.31°C (0.32°C); diurnal range has decreased by 0.14°C (0.16°C). Seidel et al. (2009) presents a climatology of humidity measurements (dew point, relative humidity, and water vapor mixing ratio) created using 1935-2004 data. This climatology includes annual, seasonal, day, night, fog, and clear-air averages. In addition, trend analysis shows, with seasonal and diurnal variation, that Mount Washington humidity has decreased over the full study period, especially during clear-air periods (Figs. 2 and 3). These results are unique compared to those from previous studies, as most observations of humidity show an increase. However, those studies generally are restricted to the last two or three decades, suggesting that the disparity is mostly due to length of record. Indeed, the Mount Washington record shows increasing trends in the past ~30 years.
FIGURE 2. WINTER CLEAR-AIR DEW POINT TIMESERIES
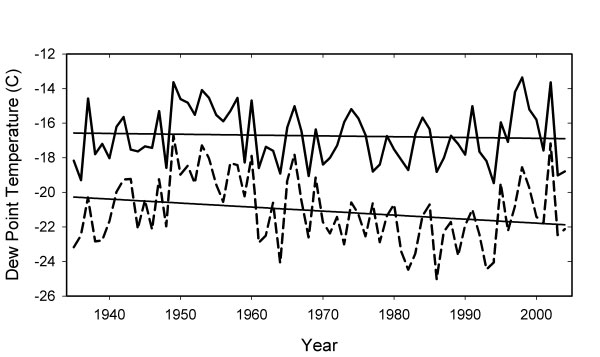 All (solid line) and clear-air (dashed line) winter dew point temperature, 1935-2004, with linear regressions.
FIGURE 3. SEASONAL DEW POINT TRENDS
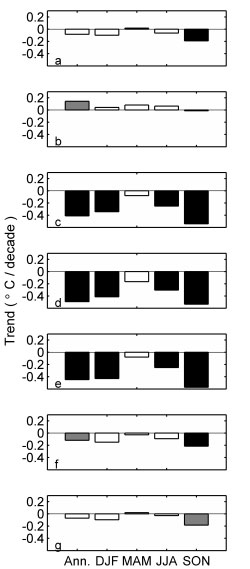
Dew point temperature decadal trends for 1939-2004. Starting from the top row the figure shows a) all, b) fog, c) clear-air, d) clear-day, e) clear-night, f) day, and g) night classes. Gray (black) shading indicates 5% (1%) significance.
REFERENCES
Grant, A.N., A.A.P. Pszenny and E.V. Fischer, 2005: The 1935-2003 air temperature record from the summit of Mount Washington, New Hampshire, USA, J. Climate, 18, 4445 4453.
Grant, A.N., A.A.P. Pszenny and E.V. Fischer, 2009: Corrigendum. J. Climate, 22, 1065-1066.
Seidel, T.M., D. Weihrauch, K.D. Kimball, A. Pszenny, R. Soboleskil, E. Crete, and G. Murray, 2009: Evidence of climate change declines with elevation based on temperature and snow records from 1930s to 2006 on Mount Washington, New Hampshire, USA. Arctic, Antarctic, and Alpine Research, 41, 362-372.
