Boundary Layer Exposure on Mount Washington Project
Mountain ecosystems provide sustaining water, natural resources, and numerous economic benefits for more than half the world’s population. Climate change threatens the stability of these mountain ecosystems and the economies they support. In New England, Mount Washington and Mount Mansfield are warming more slowly than the lower elevations (Fig. 1). This project hypothesizes that Mount Washington’s variable exposure to two distinct horizontal layers in the atmosphere, the boundary layer and the overlying free troposphere, drives a significant portion of this elevation-dependent warming.
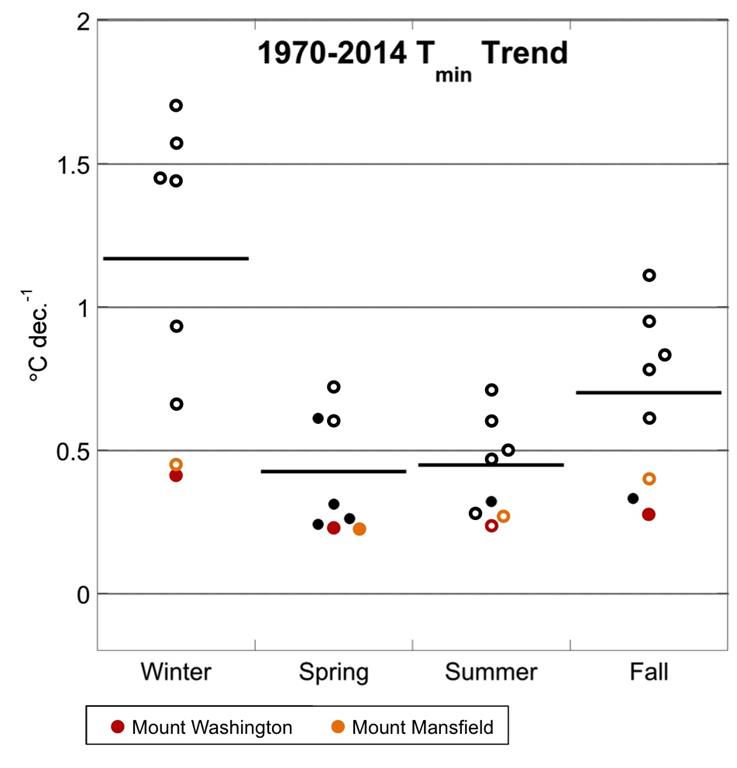
Figure 1: Minimum temperature trends for low elevation New Hampshire sites (black circles; First Connecticut Lake, Hanover, Durham, Keene, Bethlehem, Hubbard Brook), Mount Washington (red circles), and Mount Mansfield, VT (orange circles). Open circles indicate statistically significant Sen’s slope trends (p<0.05). Some low elevation temperature trend data are from Wake et al. (2014a, 2014b) and all low elevation trends are for 1970-2012.
How Boundary Layer Height Changes Can Impact Temperature Trends
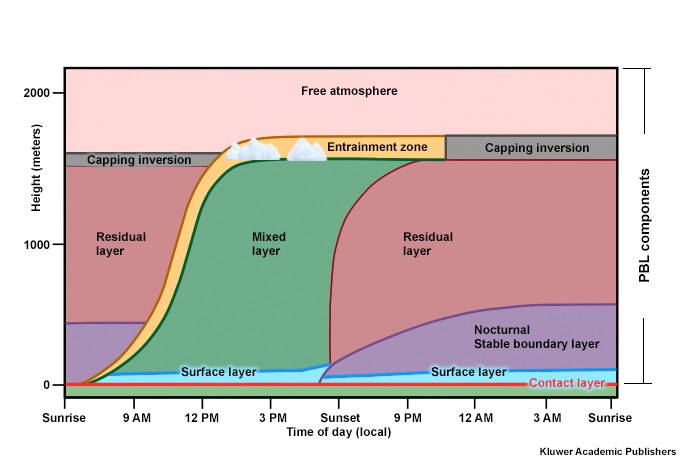
Two factors that impact the energy budget and, therefore, elevation-dependent temperature trends, are atmospheric water vapor content (Ruckstuhl et al. 2007) and cloudiness (Rangwala and Miller 2012). While previous mountain climate studies have focused on relating moisture variables, radiation, and surface temperature, no published studies have tested these relationships within the context of changing exposure to boundary layer and free tropospheric air. The boundary layer is the lowest layer of the atmosphere, typically 1-3 km deep, is often turbulent, and responds quickly to diurnal solar heating, friction as wind blows over the Earth’s surface, and nocturnal radiational cooling (Fig. 2). The free troposphere is a deeper, more laminar atmospheric layer that lies directly above the boundary layer. The temperature, humidity, cloud, and water vapor isotopic characteristics of these two air masses are typically distinct. As a result, if the frequency with which high elevations are exposed to boundary layer air masses is changing, large changes in seasonal temperature, humidity and cloud patterns might result, with significant impacts on temperature trends and mountain ecosystems.
Summer-Fall 2016 Boundary Layer Project
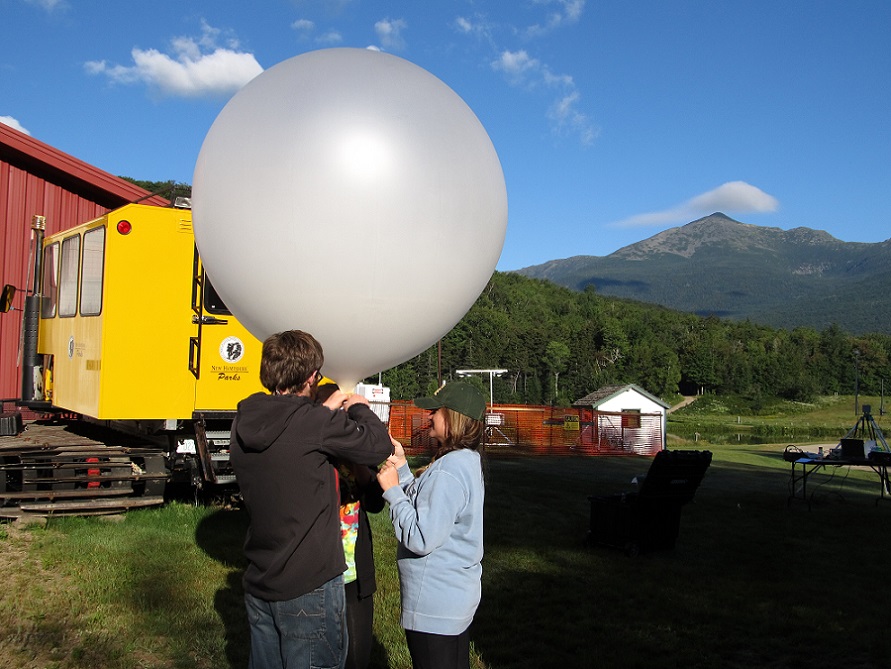
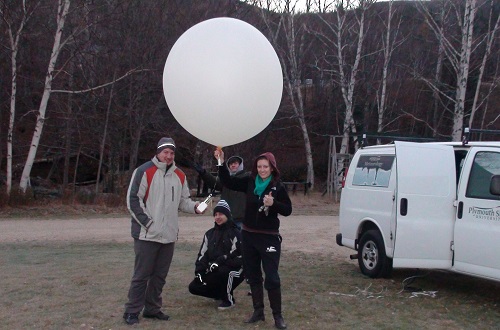
To test this hypothesis, a necessary first step is to develop a robust method for measuring the air mass type at the summit of Mount Washington. In August and September 2016, MWO, Plymouth State University and collaborators from the Appalachian Mountain Club and Dartmouth College tested a novel methodology to determine summit air mass type and the processes driving boundary layer height changes on and around Mount Washington. First, water vapor isotopes were measured at the summit of Mount Washington for six weeks during August and September. Variability in the summit isotopes reveal the types of air masses and air mass transitions at the summit and were linked with the concurrent weather patterns across the eastern US. In the second component of the project, vertical profiles of temperature, humidity, wind and stable isotopes of water were measured on two different days to assess the diel evolution of the boundary layer. Weather balloons were launched throughout these two days, from prior to sunrise to just after sunset (Fig. 3). Concurrently, we drove a water vapor isotope analyzer up and down the Mount Washington Auto Road in a truck (Fig. 4). Mountain slope temperature, humidity, and wind data from our mesonet along the Auto Road and Cog Railway were compared with the weather data over the valleys from the weather balloons.
On 19 August 2016, we executed our first intensive observation day during which we recorded vertical profiles of isotopes and weather variables. The data collected strongly suggest that despite shallow and cool boundary layers in the valleys in the early morning, a 30-40 mph wind was able to push boundary layer air upslope to the summit of Mount Washington. As a result, the summit was in an orographic cloud until the winds relaxed during the late morning. At this time, the entrainment zone (the transition layer between the boundary layer and the free troposphere) descended to the summit elevation. Entrainment zone air was confirmed by lower dewpoint values (Fig. 5) and lower stable isotope values at the summit. The summit dewpoint never reached true free tropospheric values (<10?C) seen by the weather balloon profile. Also of note is that the height of the entrainment zone (the sharp change in dewpoint around 830 hPa) over the valley is much lower than at the summit; this indicates that the entrainment zone height can be higher around a mountain due to a combination of insolation and wind pushing the boundary layer higher along the mountain slopes.
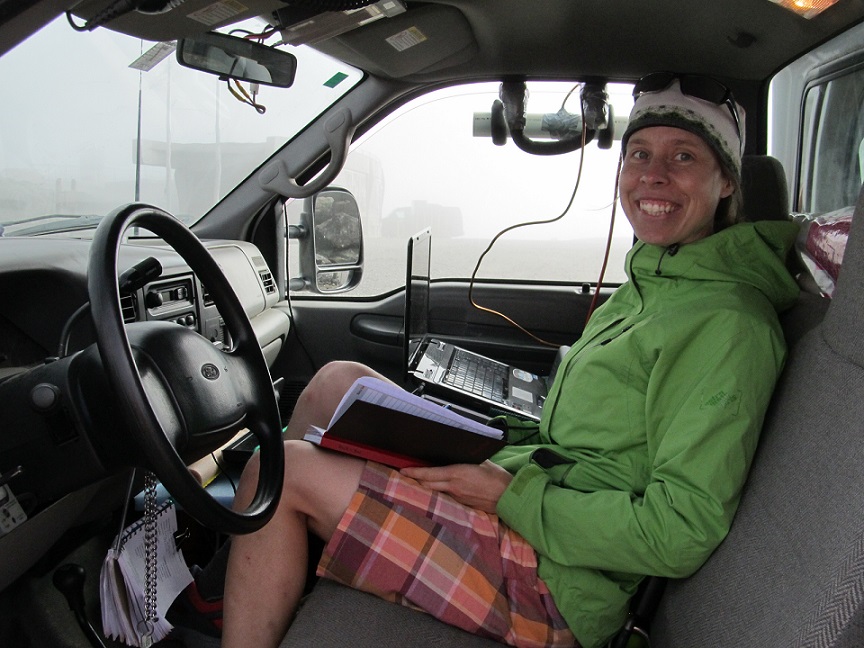
Figure 4: Adriana Bailey (Dartmouth College) sits in the MWO truck next to the water vapor isotope analyzer. The inlet to sample outside air is mounted on the window.
More results from this 2016 field project, as presented at the 34th International Conference on Alpine Meteorology in Reykjavik, is linked below.
The results of this project serve as the launching pad for future research to directly address the hypothesis that variable boundary layer exposure at high elevations significantly impacts elevation-dependent warming in mountainous regions.
Below is a video from Tom Guilmette filming the research crew as data was collected driving up and down the
Mount Washington Auto Road
Boundary Layer Exposure on Mount Washington, NH Research Project from Tom Guilmette on Vimeo.
This project is funded by a Plymouth State University research grant. Dr. Eric Kelsey (MWO Director of Research) would like to thank Dr. Heidi Asbjornsen (University of New Hampshire) for loaning her water vapor isotope analyzer for this project, and intellectual contributions from collaborators Dr. Adriana Bailey (Dartmouth) and Georgia Murray (Appalachian Mountain Club). This project would not be possible without the generous logistical support of the Mount Washington Auto Road.
Rangwala, I., and J.R. Miller, 2012: Climate change in mountains: A review of elevation-dependent warming and its possible causes. Climatic Change, 114, 527-547, doi:10.1007/s10584-012-0419-3.
Ruckstuhl, C., R. Philipona, J. Morland, and A. Ohmura, 2007: Observed relationship between surface specific humidity, integrated water vapor, and longwave downward radiation at different altitudes. J. Geophys. Res., 112, D03302, doi:10.1029/2006JD007850.
Wake, C.P., C. Keeley, E. Burakowski, P. Wilkinson, D. Hayhoe, A. Stoner, and J. LaBrance, 2014a: Climate Change in Northern New Hampshire. Past, Present, and Future. The Sustainability Institute, 78 pp.
Wake, C.P., E. Burakowski, P. Wilkinson, K. Hayhoe, A. Stoner, C. Keeley, and J. LaBranche, 2014b: Climate Change in Southern New Hampshire. Past, Present, and Future. The Sustainability Institute, 86 pp.

