
Satellite Imagery
2018-04-28 09:15:46.000 – Jillian Reynolds, Summit Intern
One tool that meteorologists use to forecast is satellite imagery. Satellite imagery is the scanning of the earth by satellite or high-flying aircraft in order to obtain information about it (globalforestlink.com). Different sensors are used by satellites in order to collect electromagnetic radiation reflected from the Earth. Different surfaces and objects can then be identified by how much radiation it reflects.
There are three main types of satellite imagery: visible, infrared, and water vapor. Each type has a unique quality that is very useful for meteorologists.
Visible Imagery
Visible satellite imagery uses reflected sunlight (solar radiation) to see objects in the atmosphere as well as on Earth’s surface. Clouds and snow will appear white on the imagery because they are excellent reflectors. The way to tell between clouds and snow is by seeing if there is movement or not. If there is movement, then it is a cloud. If not, then it is snow. The ground and bodies of water are not great reflectors, so they will appear black on imagery. Since this imagery relies on reflected imagery, it will not be useful at nighttime.
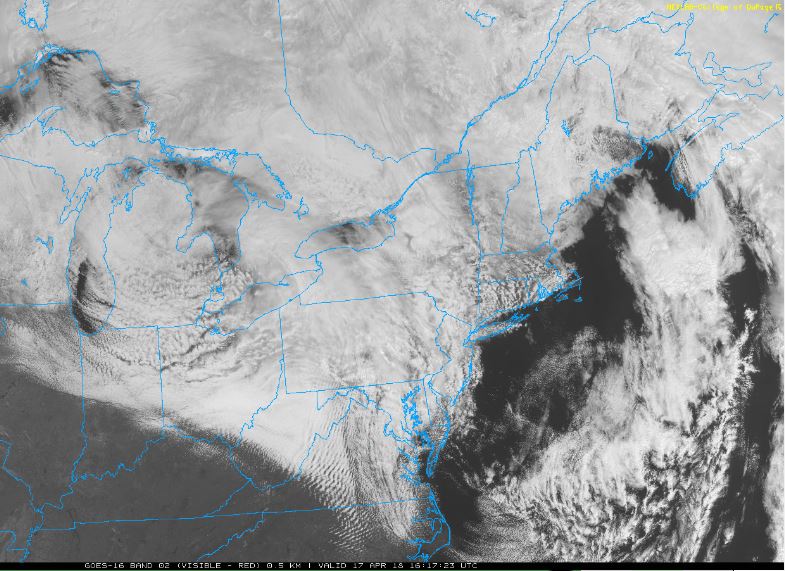 Figure 1. Visible image. Lighter colors represent clouds/snow. Darker colors represent the ground/bodies of water (weather.cod.edu).
Infrared Imagery
This satellite imagery senses surface and cloud top temperatures by measuring the wavelength of electromagnetic radiation emitted from these objects (called “infrared energy”). High clouds are very cold, so they will appear white. Mid-level clouds are a little warmer, so they will be light gray. Low clouds are even warmer, so they will appear as dark gray or black (sometimes it’s hard to distinguish it from the ground).
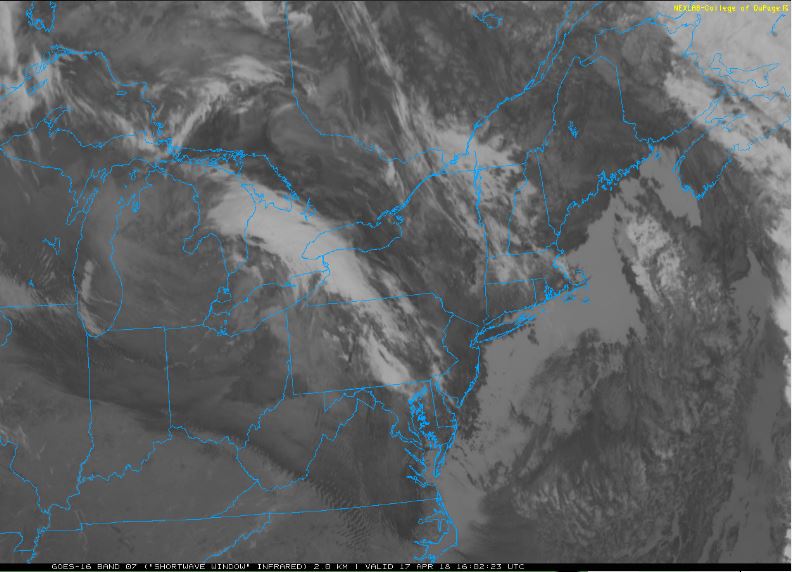 Figure 2. Infrared image. White represents high clouds. Light gray represents mid-level clouds. Dark gray/black represents low clouds/the ground (weather.cod.edu).
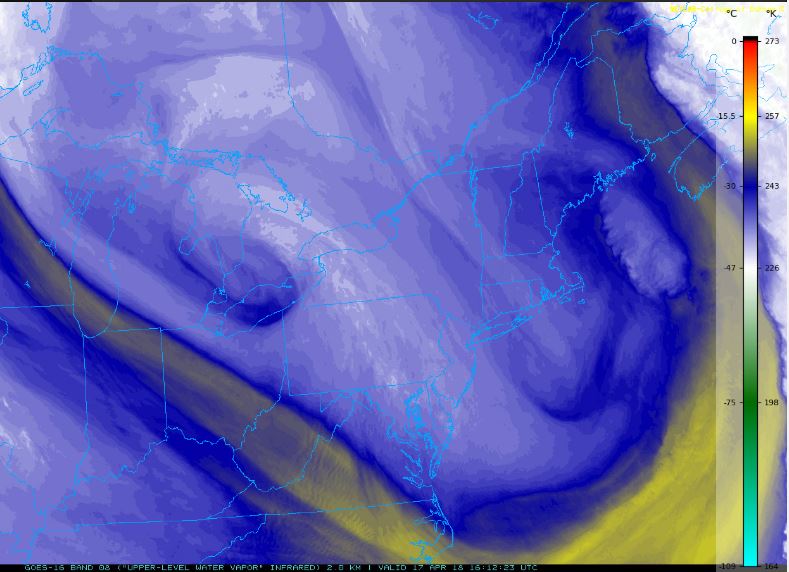
Water Vapor Imagery
Water vapor imagery depicts the amount of moisture that is present in the upper atmosphere (about 15,000–30,000 ft. above the surface). The highest humidities will be the areas with the coolest/white colors. Lower humidities will be shown with warmer colors.
Jillian Reynolds, Summit Intern

Seek the Peak Spotlight: The Cloud Chasers
Seek the Peak Spotlight: The Cloud Chasers By MWOBS Staff Mike Bergeron and Desiree Bolton have been participating and volunteering for Seek the Peak for three years now. Together, they comprise Team Cloud Chasers
Celebrating 250 Years: The Declaration’s Legacy in the White Mountains
Celebrating 250 Years: The Declaration's Legacy in the White Mountains By Peter Crane We are now approaching July Fourth, Independence Day, the day when we celebrate the adoption of the Declaration of Independence in

Seek the Peak Spotlight: Ryan Shepard
Seek the Peak Spotlight: Ryan Shepard By MWOBS Staff Before Ryan Shepard moved to Conway, he was in Western New York celebrating his 40th birthday party. “I wanted to go big,” he said. “Big”
