
Whats With The Warm Record Breaking May Temperatures?
2020-06-08 18:40:15.000 – Jay Broccolo, Weather Observer/Meteorologist
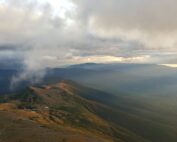
Often times, the summit is unaffected by daytime heating processes due to the positioning of the boundary layer with respect to the summit. Just in case you were wondering what the boundary layer is, the atmospheric boundary layer is the region of the lower troposphere that is heavily influenced by the surface of the Earth. The surface holds heat, radiation and moisture, and it also causes friction with any moving air mass. Flow within the boundary layer tends to be relatively turbulent compared to the statically stable layer of air or a temperature inversion. Sometimes you may even be able to spot a temperature inversion on our current summits page!
When the summit broke some of its daily and a monthly record, the Boundary Layer was likely above the summit, which allowed the summit to take advantage of diurnal heating with all that plentiful sunshine and lack of wind. This likely nudged the temperature up a few degrees, but was not the dominant factor. The big factor for the unseasonably warm and nice weather was actually the synoptic pattern that brought warm Gulf of Mexico and Continental air masses to the Northeast over several days. Before we get into that though, look at the records that were set (Thanks to Dr. Eric Kelsey for the stats).
High temperatures:
26th: 62°F (daily record; old record 59°F)
27th: 66°F (daily record, tied May monthly record; old daily record 63°F)
28th: 62°F (no records set; significantly more clouds and fog, but still warm)
Also notable is that the minimum temperature on the 27th was a toasty 56°F, which set a new monthly record high minimum temperature (previous record 53°F). This makes the daily mean temperature of 61°F, which broke the previous warmest daily mean temperature for the month of May of 58.5°F on the 22nd of May, 1977 (in other words, Wednesday was the warmest May day on record). The 61°F is also just the 77th time since the 1st of Jan, 1935 that the summit has had a daily mean temperature ≥ 61°F (a less an once per year occurrence, all others occurring June – Sept).
Okay, back to the synoptic pattern, because that is OBVIOUSLY what everyone is interested in. There is a lot of content in these charts, but the folks at NCEP with NOAA do far too good of a job and they are the perfect tools. Without any further ado, I present, pretty weather pictures!


Beginning on the 25th and progressing through to the 28th of May, notice the trough dip into the Gulf of Mexico and the ridge expand and reach into Canada as they move east. These upper level features have a significant effect on the surface. The low was able to entrain a great deal of moisture and heat from the Gulf as its counterclockwise rotation hurled the warmer and humid air mass north and aloft to be caught by the clockwise rotation of the ridge to the east. You can correlate the orange of the Maximum Temperature map to that of the contour lines of the 500 mb Height map.
Another feature that is worth mentioning is all the precipitation that occurred between the trough and the ridge. As the warm and humid rising air mass from the trough collides with descending cooler and drier air mass from the ridge, the two air masses mix and some of that moisture mixes out and condenses to fall as rain. In doing so, a portion of the heat trapped in the water vapor is released into the atmosphere as it changes phases to water. This process, known as latent heat release, likely added a bit of heat as well.
And there you have it. There is certainly more to the whole story but this discussion tapped into a few of the main reasons why the summit experienced such a warm spell so early in the season. It’s not often to see a trough dip so far south and a ridge so far north, and certainly even rarer to see them both happen at the same time so late into the year. Normally mid-latitude wave features like those occur during the winter and not a few weeks before summer.
If you care to check out the full version of these plots including a surface synoptic map, check out https://www.wpc.ncep.noaa.gov/dailywxmap/
Jay Broccolo, Weather Observer/Meteorologist
Seek the Peak Spotlight: The Cloud Chasers
Seek the Peak Spotlight: The Cloud Chasers By MWOBS Staff Mike Bergeron and Desiree Bolton have been participating and volunteering for Seek the Peak for three years now. Together, they comprise Team Cloud Chasers
Celebrating 250 Years: The Declaration’s Legacy in the White Mountains
Celebrating 250 Years: The Declaration's Legacy in the White Mountains By Peter Crane We are now approaching July Fourth, Independence Day, the day when we celebrate the adoption of the Declaration of Independence in

Seek the Peak Spotlight: Ryan Shepard
Seek the Peak Spotlight: Ryan Shepard By MWOBS Staff Before Ryan Shepard moved to Conway, he was in Western New York celebrating his 40th birthday party. “I wanted to go big,” he said. “Big”
