
Windy Year Statistics so Far
2019-02-04 13:28:45.000 – Adam Gill, Weather Observer/IT Specialist
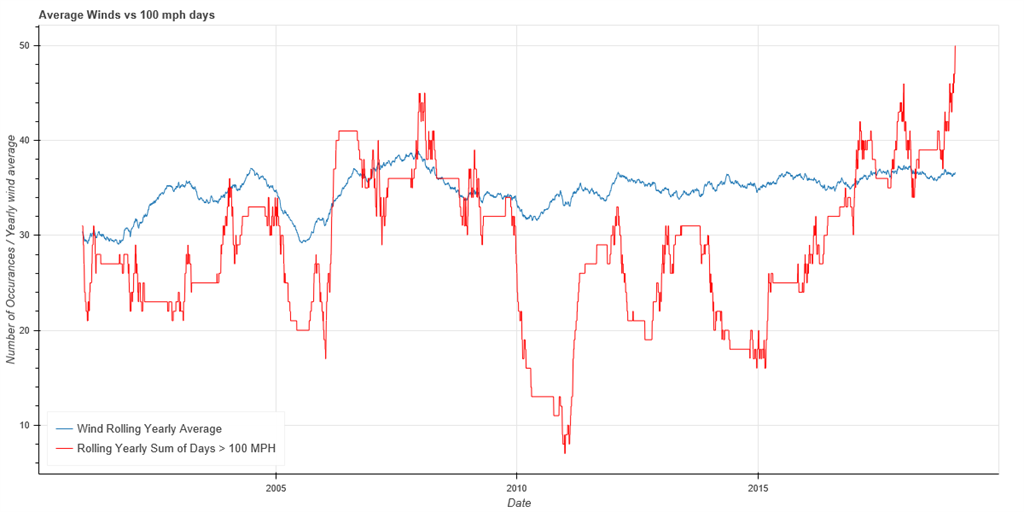
There have been several blogs so far over the past few weeks that have been talking about how windy this winter has been compared to past winters. I pulled together some data and did some light analysis on it to see how it stacks up as well. I grabbed daily average winds and then created a Boolean where if the day had winds over 100 it was 1 and if not it was zero. I then created a running average over 365 days for the wind speed and then a 365 rolling sum for the winds over 100 mph to compare the average value and the amount of 100 mph days we have seen. The snapshot will just be from January 1st 2000 to February 2nd 2019.
From the entire snapshot, it is apparent that this is the most 100 mph days we have seen in a 365 day period in the last 20 years so that is super exciting! We have seen 100 mph or more on 50 of the last 365 days, the last time we had that many was back in the early 90’s! Looking at the blue average line, we do not see much of a difference though. In the late 2000’s winds were averaging a little bit higher but we have been on a gradual upward swing since 2015.
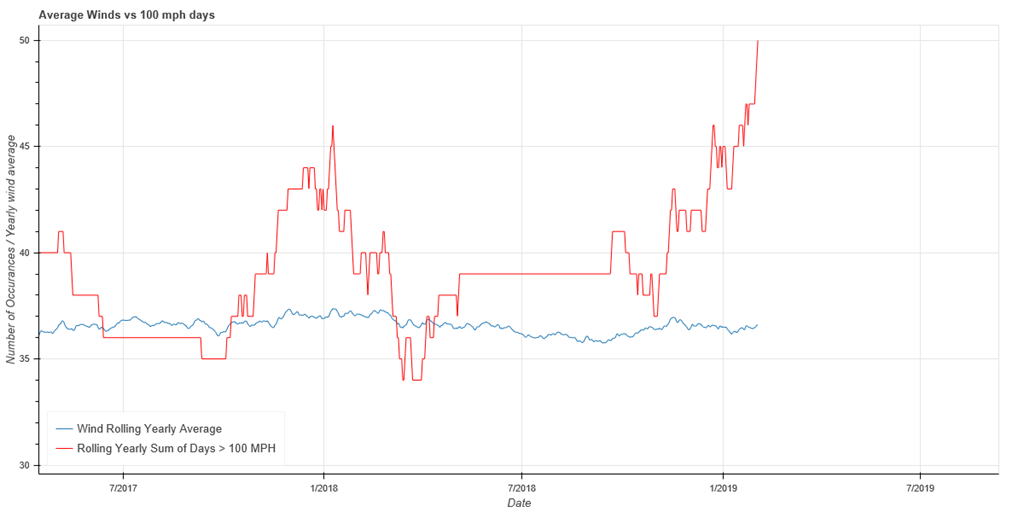
Zooming in on the last few years there even is a slight downward trend of the wind speed average. One of the things that could be a cause of so may 100+ mph days is the storm track this year. It seems that many storms are taking optimal tracks that are giving us high winds for several days in a row then high pressure builds in leading to a couple of quiet days keeping our wind speed average, well, average.
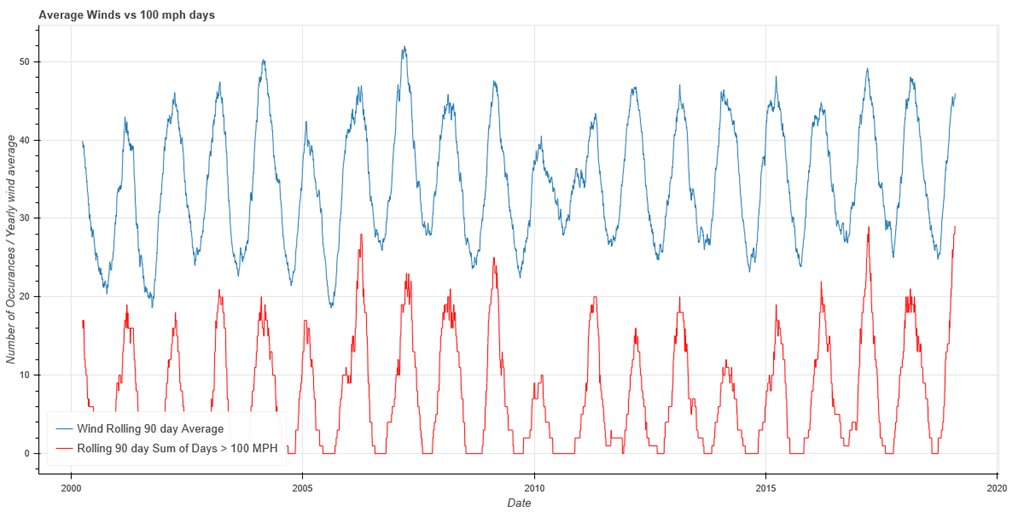
Now breaking the data down into seasons with a rolling 90 day sum and average we can see how many hundred mph days occurred in each winter and fall season. It is interesting to note that the highest seasonal average in 2007 had only the 4th highest about of 100 mph days in the season. It is also really cool to see that this year is already in 3rd place in the last 20 years and we still have a bit of winter to go!
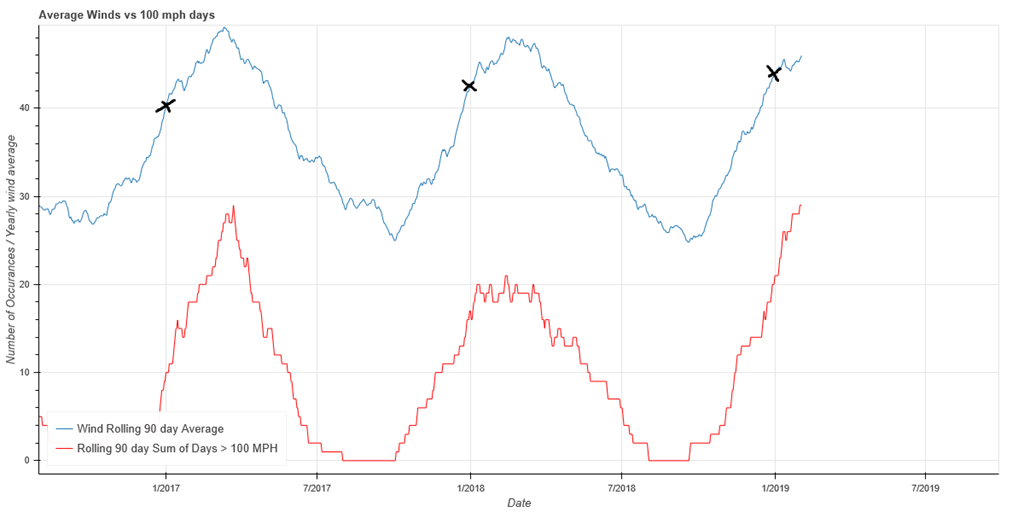
Zooming in on the last 3 years again, it is cool to see the variation in 100 mph days, especially having been up here for those three winters. 2016-2017 was slow early on but picked up in January with both January 2017 and January 2019 having 11 days reaching 100 plus. Last year the 100 mph winds were more evenly split between all the months, consistently getting 6-7 days over 100 per month. So with the 90 day rolling sum, you don’t see a peak but more of a plateau. This year has been fairly exceptional so far with 9 days over 100 in November and December then 11 in January! This month we have already seen two 100 mph days and looking ahead we will have several more chances of seeing 100 mph or more so its looking like another big month.
Here is a link to the Python code I used to create these graphs
Adam Gill, Weather Observer/IT Specialist

Seek the Peak Spotlight: The Cloud Chasers
Seek the Peak Spotlight: The Cloud Chasers By MWOBS Staff Mike Bergeron and Desiree Bolton have been participating and volunteering for Seek the Peak for three years now. Together, they comprise Team Cloud Chasers
Celebrating 250 Years: The Declaration’s Legacy in the White Mountains
Celebrating 250 Years: The Declaration's Legacy in the White Mountains By Peter Crane We are now approaching July Fourth, Independence Day, the day when we celebrate the adoption of the Declaration of Independence in

Seek the Peak Spotlight: Ryan Shepard
Seek the Peak Spotlight: Ryan Shepard By MWOBS Staff Before Ryan Shepard moved to Conway, he was in Western New York celebrating his 40th birthday party. “I wanted to go big,” he said. “Big”
