
A Closer Look at Elevation-Based Temperature Swings
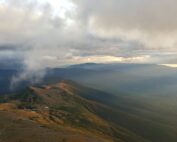
As you go up in the atmosphere, daily temperature swings become relatively lower compared to those on the surface. This is primarily because air is relatively transparent to solar radiation, which is the reason that on clear days at Mount Washington Observatory, we can see 130 miles to our west, all the way to the high peaks of the Adirondack Mountains in New York.
Generally, incoming solar radiation that is not reflected by clouds or white, snowy surfaces transits the atmosphere and is only absorbed when it hits land, vegetation, or a water surface. When it is absorbed in this way, these surfaces heat up and pass this energy to air molecules in direct contact with them. This causes air to begin to move, with relatively warmer air rising, and relatively cooler air descending and taking its place.
In heat transfer terms, this is called convection, and it is how the majority of heat energy is transferred when a fluid, like air or water, is allowed to circulate freely. Convection does take time to occur, and takes longer and longer the higher you go in the atmosphere until, several thousand feet above the surface, daily temperature swings are quite small and on the order of less than 1 degree C.
How does this apply to Mount Washington?
Mount Washington in this context is a little bit like both of the end points we considered earlier. It is a prominent mountain which juts far up into the atmosphere, but importantly, it still has a surface which absorbs solar radiation. So, as you ascend the mountain from the valley floor to the summit, you would expect that daily temperature variation would decrease as you are influenced more by the air flowing at higher altitudes, and less by the surface directly below you. In a sense you are ‘feeling’ less of the influence of the Earth’s surface directly below you and becoming more influenced by the slowly varying temperature of the air high above the surrounding ground.
So, putting two and two together, if you are ascending into the atmosphere on a mountainside, you are still standing on a surface (hopefully!), but you are being surrounded by proportionally more air and less surface until you reach the peak. Since the surface is where most solar radiation is absorbed, this should equate to a progressive lowering of the daily temperature range as you go up, becoming a minimum at the summit.
Is this what we see in the data?
As you may have noticed on our current summit conditions page, we can test this using the weather stations we have located at roughly 1,000 foot intervals on the east side of the mountain adjacent to the Mount Washington Auto Road. For the last seven years, we have been recording temperature data at each of these stations roughly every minute between Jan. 1, 2016 and the present, though for data uniformity purposes, I decided to only use data up until Dec. 31, 2022 so that each month, season, and the overall daily averages would be as uniform as possible.
Let’s look at the resulting figure.

So, to make this figure, data from every day between Jan. 1., 2016 and Dec. 1, 2022, a total of 2,557 days, was downloaded and then broken into 10-minute intervals (00:00, 00:10, 00:20…etc). At each timestep, the temperature at each station was averaged. Averaging the data in this way over this long of an interval is a good way to examine the sun’s influence on elevation-specific temperature trends, as it evens out the cold snaps with the heat waves, flattening out much of the day-to-day weather variation and leaving the mean daily solar cycle over the year to shine through.
This is similar to the kind of variation you would experience at each of these stations during an average fall or spring day, when the average daily temperature would best approximate the yearly average temperature. Likewise, if you were to take the sum of the temperatures at each 10-minute interval shown on the plot, and divide by 144 (the number of 10-minute intervals in one day), the average would be equivalent to the annual average temperature at that station. On this figure, the lower elevation stations have relatively lighter lines, and the higher elevation stations have relatively darker lines, with each elevation of each station listed in feet in the legend to the right.
As you can see, the lowest elevation station has by far the greatest daily range between its high and low temperature, as well as the highest average temperature, while the summit has both the lowest daily range, as well as the lowest average temperature. The decrease in the daily temperature range is not necessarily linear with increasing elevation, with variation decreasing more between the stations at 1600 and 2300 feet than between the stations at 5300 feet and the summit, located at 6288 feet. This has something to do with boundary layer and how that forms, which is a topic I’ll save for a later comment.
The reason that the average temperatures decrease as you go up in the atmosphere is because air, because it is gas, expands when it travels from areas of higher pressure (i.e. near the surface, or Pinkham Notch in this case) to areas of lower pressure (i.e. near the summit). This is analogous to what happens when you place your finger over the valve of a car or bike tire. When the air escapes from the high pressure found in the tire to the low pressure of the ambient air, it cools as it expands.
Finally, for something a little more interesting, below are figures that will look at bit more complicated and that I will not fully explain, but that look cool and show how the daily variations change month-by-month, instead of averaging all the days together as one. I’ve included only one station in each of the plots below; it would be a little too busy otherwise. These figures highlight the two most “extreme” stations, the lowest elevation station near Pinkham Notch at 1600 feet and the summit station at 6288.


These figures were generated the same way as the first figure was above, only instead of averaging all 2,557 days together as one, I separated them out by month first. In addition, so that all months could be shown together more easily on one figure, I elected to subtract out the mean monthly average temperature so that differences between the months could more easily be seen. The y-axis is the temperature anomaly at each time from its corresponding monthly average. The winter months on these figures are warmer shades of red and pink and orange, while the summer months are cooler shades of green and blue.
You can also clearly see in the figures the dramatic influence that the sun has on the daily cycle in the summer as compared to the winter, with the daily ranges at both stations roughly doubling between the winter and summer months. In addition, it is easy to see that during the summer, temperatures begin to rise a bit earlier and start to decrease a bit later in the summer than they do in the winter because the sun rises earlier and sets later in the summer versus the winter. There are several more peculiarities in these graphs that I may spotlight in a future comment.
These insights are part of our broader research into the seasonal near-surface lapse rate (NSLR) in the White Mountains. Understanding how the temperature changes with elevation is valuable for a variety of applications, from the Observatory’s forecasting to academic studies in the region.
Karl Philippoff, Weather Observer – Research and IT
Seek the Peak Spotlight: The Cloud Chasers
Seek the Peak Spotlight: The Cloud Chasers By MWOBS Staff Mike Bergeron and Desiree Bolton have been participating and volunteering for Seek the Peak for three years now. Together, they comprise Team Cloud Chasers
Celebrating 250 Years: The Declaration’s Legacy in the White Mountains
Celebrating 250 Years: The Declaration's Legacy in the White Mountains By Peter Crane We are now approaching July Fourth, Independence Day, the day when we celebrate the adoption of the Declaration of Independence in

Seek the Peak Spotlight: Ryan Shepard
Seek the Peak Spotlight: Ryan Shepard By MWOBS Staff Before Ryan Shepard moved to Conway, he was in Western New York celebrating his 40th birthday party. “I wanted to go big,” he said. “Big”
