
A Windy Start to March: A Look at Forecasting (and Battling) Category 4 Level Gusts
By Charlie Peachey
This winter at the Observatory has been freezing and, recently, historically windy. Just a few weeks ago, we recorded a wind gust of 161 mph and had thirty-nine consecutive hours of gusts over 100 mph. 161 mph would be windy by anyone’s standards, but it also holds up to some of the most significant wind records we have ever recorded at the Observatory. In fact, it was the second-highest wind gust we have recorded on the summit since 1994, 3rd highest gust recorded in February, and the 20th highest wind gust ever recorded. So, for all but two staff members at the Observatory, that was the highest wind gust that any current staff has ever experienced. That is a significant fact, especially because we all take pride in (and brag about) the top wind speeds we’ve personally experienced, and I wasn’t lucky enough to work during it! Needless to say, it leads to a lot of bragging rights among us as weather observers.
The rarity of the extreme wind gusts in February made me even more excited about the possibility of an extreme wind event when I started my first shift this March. With early model runs coming out on Wednesday, our typical shift change day indicated the potential for a significant wind event to set up, but the models were all over the place based on what they were forecasting. It was primarily because we were still about 48 hours away from the event’s peak, but the spring-like weather pattern also played a large part in the uncertainty.
Typically, the network of supercomputers running NOAA’s weather model changes their various algorithms based on the seasons to better forecast each season’s specific challenges. When we get to the transition between seasons, they can sometimes have difficulty understanding which algorithm to use, leading to significant errors in the forecast. As meteorologists, it is our job to interpret when these errors exist in the model and then use our judgment to think of what will happen. It is one of the reasons why a knowledgeable human forecaster will always be better than a single computer model. This is often the case with us at the summit since models don’t understand the complex terrain of the Presidential range very well, so we frequently use our own experience to fill the gaps the weather models leave. This was precisely the case during the forecast I created Wednesday afternoon.
The three models that I typically use to forecast 24-48 hours out, the GFS, NAM, and MOS Output Bulletins, all had very different scenarios of what would happen on Friday regarding the strength and timing of the winds specifically. As previously mentioned, wind gusts up near 150-160 mph are nearing historic-level gusts at the observatory, so I knew that the models wouldn’t do well with this event due to a lack of prior data during these events. I also knew that this was a very spring-like storm during a time of the year when the weather models are typically still using their winter algorithms, so it is another potential source of error in the models. Therefore, I had to use all of the tricks I learned in school and rely upon my years of experience in the White Mountains to overcome the inherent errors in the models.
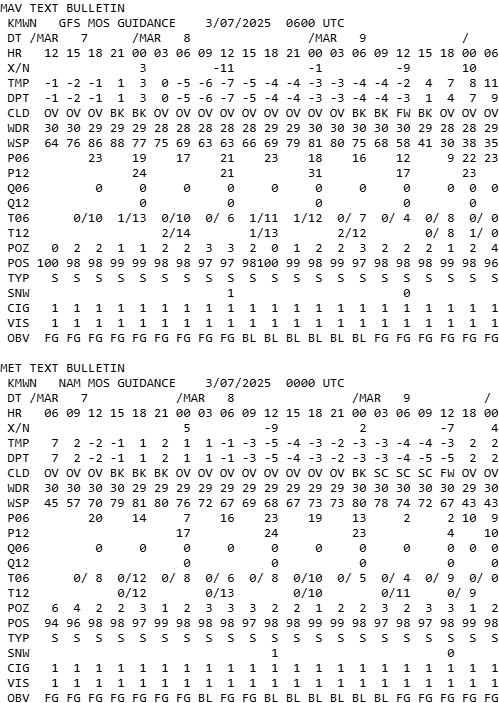
A table of the MOS Output Bullitens from Friday morning 3/9. The bulletin on the top is the GFS-based MOS, and the table on the bottom is the NAM-based MOS. For more info on how to interpret the MOS bulletins, click here.
When initially looking at the GFS and NAM models, there was a considerable discrepancy between them, which isn’t typical of a storm less than 48 hours away. This also started to tip me off: I would have to trust my judgment more than the models during this storm. So I quickly pivoted with what tools I was using to forecast. Instead of using models that predict how the weather was going to change in the future, I began by seeing how the storm was currently looking like, using radar and satellite imagery along with data from various types of weather observations. By looking at the initial conditions, I could see the storm’s structure and the path it was headed on. From there, I came up with my projection of how I thought the storm would play out on its track from the continental southeast to New England. That’s when I could start looking at the future model projections; I could compare them to my projection to understand their error. Once I could make that comparison, it became apparent that the GFS model was under-forecasting the event while the NAM model was severely mis-forecasting the event. However, both models were still helpful to me despite their discrepancies. They verified my thoughts on the event’s timing and showed some dynamics that would develop along with this storm to produce a significant wind event.
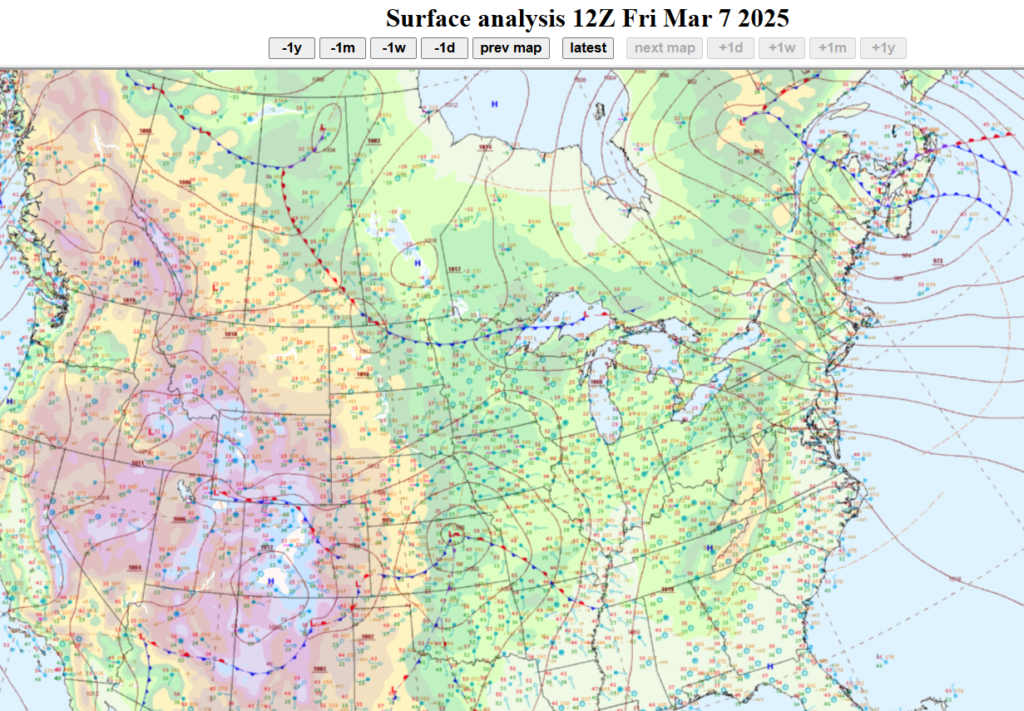
12Z Surface analysis of frontal systems and high and low-pressure centers (Obtained from the Weather Prediction Centers website).
Once I was confident about the possibility of a historically high wind event, I began dialing in the setup to come up with my final wind forecast. Eventually, what I settled on was this:
A large and messy mid-level low-pressure system would make its way up through the Ohio Valley, eventually resulting in a secondary low pressure developing off the coast of New Jersey at the surface. Then, as these two lows begin moving up through New England and eventually over Nova Scotia, a “double barrel” low-pressure system would set up early Thursday morning. Then, as both lows continue to meander up the coast, they’d become vertically stacked on Friday afternoon, which will cause the highest winds. At the same time, high pressure along the southeastern Atlantic coast should eventually move into the area, which will cause the pressure gradient to tighten and winds to increase even more, a typical “double barrel” low setup.
From there, I used my judgment again to know this setup was typically able to produce wind gusts up 140-150 mph, so that is what I ultimately felt confident about putting into my final forecast. If I were to have solely listened to what the computer models were saying, I would’ve forecasted winds to be much lower. It was a great decision not to fully trust the computer models because the strongest wind gust we received on Friday, March 7th, was 138 mph. I would’ve provided an accurate forecast of much lower winds, which could’ve been dangerous if someone had read my forecast, thought the winds were low enough to hike to one of the higher summits, and then got blown off the mountain trying to get there.
This extreme wind event shows the importance of us human weather observers staffing the Observatory 24/7. Without our expertise in the weather patterns that make us the “Home of the World’s Worst Weather,” weather forecasts would be more inaccurate for the higher summits, which could lead to serious danger for any members of the outdoors community looking to recreate in the White Mountains.
As previously mentioned, wind events of this magnitude are uncommon for the Observatory, but they do tend to happen once or twice per winter. In fact, a similar wind event occurred last February on my shift, but the winds gusted even higher to a staggering 147 mph. Therefore, whenever we experience one of these rare, extreme, awe-inspiring wind events, we get incredibly excited as weather observers, and this past storm was no different. It’s one of the reasons that productivity dropped Friday morning in the summit office.
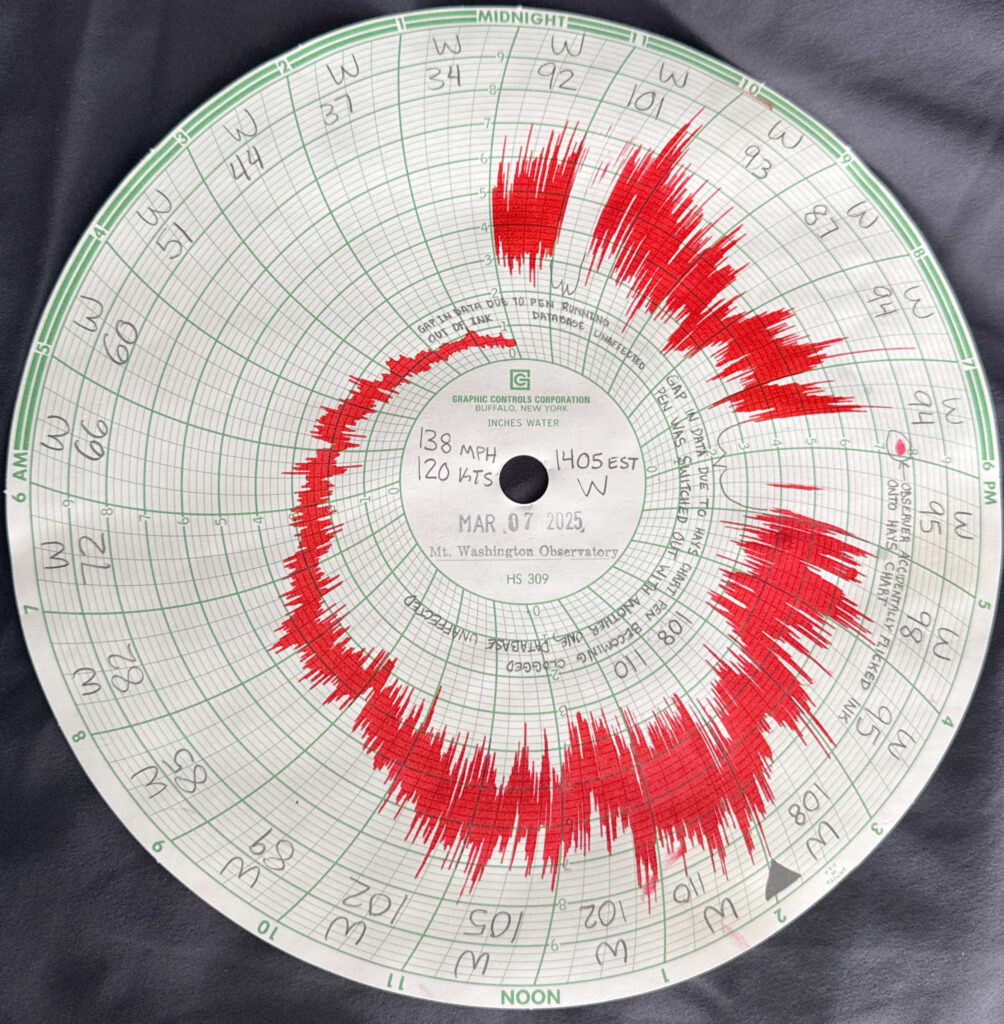
The Hays Chart for 3/7/25. A Hays chart is a graph of the wind speed for 24 hours. The chart rotates on a device while a needle automatically records the wind speed on the chart. Much like a seismograph, the higher the wind speeds, the higher the needle will go on the chart. The black arrow on the bottom right of the chart indicates when the highest gust of the day, 138 mph, took place.
Our two current interns, the other day observer, and I were glued to the Hays chart, pictured above, and our Current Summit Conditions were displayed on our weather wall for most of the afternoon and evening. Whenever we heard the building creak and get hit by rime ice projectiles, our heads would snap to the weather wall in hopes of another record gust. We were often disappointed to see the gusts were only 120mph, but when the winds began frequently gusting 130+ mph, our valley offices in North Conway lost power, which knocked out our servers and most of our weather wall. Seeing the high wind gusts made things much more challenging, so we had to look at the physical chart and speculate if the most recent line drawn was the highest or below the others. It sparked many debates on whether we topped our most recent wind gust, so at a certain point, the only way to figure out how fast the winds truly were was to go out and experience them firsthand.
Thanks to our fantastic gear sponsors and years of training, we were prepared to go out in the extreme conditions. Because, unlike most people, our job is to brave the most extreme weather in the world to maintain a vital long-term climate data record. So in the name of science, we all bundled up in our top-of-the-line gear provided by various sponsors as well as our own personal ski helmets and went outside to determine once and for all just how fast the winds were (Spoiler alert, they were EXTREME!).
After some discussion, we determined the safest way to experience the winds outside would be to sit down on the deck and see how far across the flat deck we could be blown. Therefore, we made a single file line out the door and started to crawl out on the observation deck in an attempt to get in a horizontal line. After a few seconds of crawling, I realized that my 20-foot journey might not be possible. Wind gusts of 120 mph+ were attempting to pick me up and blow me across the deck at every chance they got, so I had to begin army crawling with my chest to the ground to make it to the starting line.
After a few minutes, I was able to get in position to start, and I began waving over to the others to join me. Only about two of us were able to get into position when one of our interns lost their grip and began sliding across the deck. Once we saw the false start, the remaining three of us decided to take off ourselves and made it most of the way across the deck, which surprised everyone. We didn’t propel ourselves; all we did was sit up and let the winds push us, so we knew the immense force the current wind gusts produced.
Being pushed further than expected, I knew it wouldn’t be an easy journey back to the door, so we all immediately began army crawling the 100 feet back to the warmth of the building. Needless to say, the crawl back to the door was way more difficult than the crawl to get into position, but that is where our years of experience and safety training were key. We all understood that as long as we stayed close to the ground, we could safely make it back into the building, which is precisely what we did.
Even after working and living on the summit for over a year and a half, these extreme weather events are still just as fascinating. The inner weather nerd in me gets to come out during these storms to enjoy the beauty and power of Mother Nature. I also get to use my passion for meteorology to help educate the outdoor community about how upcoming weather patterns’ might affect them and the best way to remain safe.
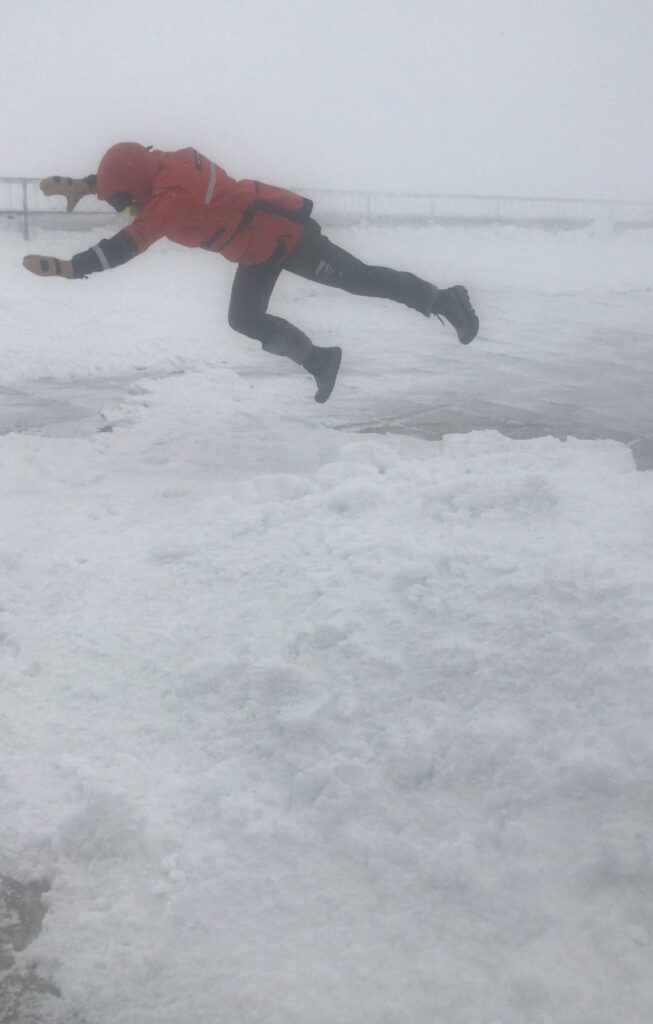
A picture of me being blown back by 110+ mph wind gusts earlier in the day while out taking the hourly weather observation.
Seek the Peak Spotlight: The Cloud Chasers
Seek the Peak Spotlight: The Cloud Chasers By MWOBS Staff Mike Bergeron and Desiree Bolton have been participating and volunteering for Seek the Peak for three years now. Together, they comprise Team Cloud Chasers
Celebrating 250 Years: The Declaration’s Legacy in the White Mountains
Celebrating 250 Years: The Declaration's Legacy in the White Mountains By Peter Crane We are now approaching July Fourth, Independence Day, the day when we celebrate the adoption of the Declaration of Independence in
Seek the Peak Spotlight: Ryan Shepard
Seek the Peak Spotlight: Ryan Shepard By MWOBS Staff Before Ryan Shepard moved to Conway, he was in Western New York celebrating his 40th birthday party. “I wanted to go big,” he said. “Big”
