
labview projects
2008-08-11 10:38:36.000 – Jeff Wehrwein, Summit Intern

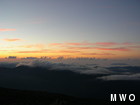
Pre-sunrise clouds over Wildcat.
This week, I have been working on a project that relates to the current summit conditions page on our web site. That page is actually just a screen shot of a program that pulls data from our databases every minute. The program is written using LabView, which is a programming environment designed for working with instruments and data. It runs in several locations, including our living room here on the summit. At some point, the one in the living room stopped working properly, and I have been tasked with fixing it. Unfortunately, the program was last updated several years ago when there was still somebody at the Observatory who knew how to use LabView. Nobody on the current staff knows much about LabView, so Steve and I have been trying to learn how it works.
LabView is not a typical programming language – programs are constructed using pictures rather than lines of code. Instead of words, it uses little icons (“instruments”) connected by lines (“wires”) to create a program. For example, to create a program that adds two numbers together, source code for an ordinary programming language would look something like this:
int A = 50;
int B = 23;
int sum = A + B;
In LabView, the source code for such a program would be a a diagram like this. This looks relatively simple, but more complicated programs quickly become cryptic to untrained eyes. For example, here is part of the source code for the current summit conditions page – the whole thing doesn’t even fit on my computer screen. I have been trying to decipher the code bit by bit, though it still looks like a garbled mess at this point.
LabView has many other uses up here on the summit. Many of our instruments are connected to a complex LabView program that processes the data and inserts it into our database. The “real wind” project, which Brian mentioned in a comment on March 28th, also requires an understanding of LabView. The goal of that project is to replace assumed values for temperature and pressure with the current values when calculating wind speeds measured by the pitot. Currently, when we have a large gust such as the one Brian discussed in March, we have to correct the measurement by hand, which is a time-consuming process. This and many other projects are on the list for when we figure out LabView.
Jeff Wehrwein, Summit Intern
Celebrating 250 Years: The Declaration’s Legacy in the White Mountains
Celebrating 250 Years: The Declaration's Legacy in the White Mountains By Peter Crane We are now approaching July Fourth, Independence Day, the day when we celebrate the adoption of the Declaration of Independence in
Seek the Peak Spotlight: Ryan Shepard
Seek the Peak Spotlight: Ryan Shepard By MWOBS Staff Before Ryan Shepard moved to Conway, he was in Western New York celebrating his 40th birthday party. “I wanted to go big,” he said. “Big”
From Florida Heat to the Rockpile
From Florida Heat to the Rockpile By Alek Libby Hi everyone! My name is Alek Libby, and I am one of the summit interns here at Mount Washington Observatory this summer! I recently graduated
