
METAR: The Secrets of Weather Decoded!
2011-10-06 22:08:06.000 – Rick Giard, Weather Observer/Education Specialist
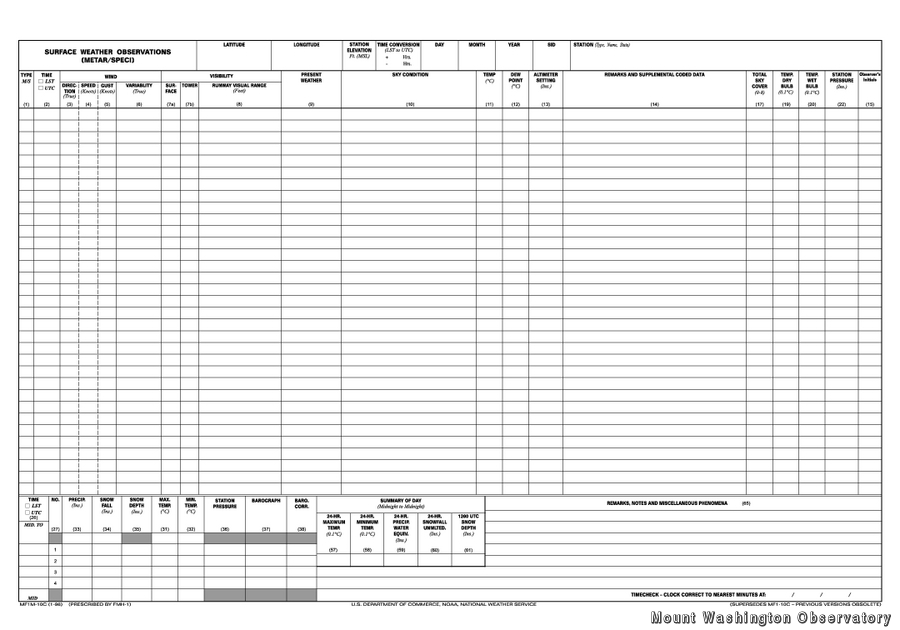
Daily Weather Coding Sheet
Anyone who tunes in to the weathercasters at regional and national news channels knows a fair amount of meteorological jargon: isobars, fronts, pressure gradients and the like. As one who has studied meteorology on a serious basis recently, I have a reasonable understanding of the basic atmospheric science. Essentially, serious meteorology is physics, chemistry and mathematics applied to the atmosphere. Computer models and human forecasters begin with current conditions, then attempt to prognosticate what will change (or not) in the foreseeable future. However, as any experienced forecaster will tell you, this is not an easy task. One crucial element to the process is having accurate, detailed data on current conditions to begin with.
The practice of observing, recording, coding, and transmitting weather conditions is a challenging and laborious task. MWOBS has performed this mission continuously for nearly 80 years in one of the most extreme locations on the planet. At many other stations the human observer has been removed, replaced by automated systems. However, machines do not provide the same quality and quantity of information. For example, automated station sensors report up to three levels of clouds, and detect none above 12,000 feet. Human observers report up to six levels at any heights above, at, or below the station. More information means a better starting point for analysis.
Besides taking complete, accurate observations, the observer must also correctly code weather elements for storage and dissemination. The basic coding “language” used by the meteorological community is known as METAR. This acronym stands for “Aviation Routine Weather Report”, designed and used originally for commercial and military aviation organizations as a concise format to efficiently distribute routine and critical weather information to pilots. To the untrained eye these cryptic strings of character groups may seem unintelligible. However, those fluent in this weather language can see at a glance much valuable information. Here is one example showing today’s hourly observation at 7:00 AM EST.
ZCZC PWMMTRMWN TTAA00 KGYX 061153Z METAR KMWN 061153Z 31060G65KT 120SM FEW/// FEW160 FEW200 M09/M12 RMK TPS LWR FEW058 70011 11073 21097 NNNN
Let us interpret (decode) some of this:
KGYX –> Transmitted to Gray, ME National Weather Service
061153Z –> Day 6 Hour 11 Minutes 53 in “Zulu” or Greenwich Meridian Time
KMWN –> Report from station at Mount Washington, NH
31060G65KT –> Wind 310 deg. (NW) at 60 knots gusting 65
120SM –> Horizontal visibility 120 statute miles
FEW/// FEW160 FEW200 –> Three cloud layers: below summit, 16000 ft., 20000 ft.; overall coverage 1 to 2 eighths of the sky
M09/M12 –> Temperature minus 9 deg. C, Dew Point minus 12 deg. C
70011 –> 24-hour precipitation liquid amount 0.11 inches
11073 –> 6-hourly maximum temperature minus 7.3 deg. C
21097 –> 6-hourly minimum temperature minus 9.7 deg. C
As you can see, this string of characters packs a lot of information into a small space. Each time a weather observation is reported, all stations (automated and manual) follow the same rules and language, with minor differences in some countries. And, this is only one small part of routine observational tasks – 24 times daily, 365 days per year!
Rick Giard, Weather Observer/Education Specialist

Seek the Peak Spotlight: The Cloud Chasers
Seek the Peak Spotlight: The Cloud Chasers By MWOBS Staff Mike Bergeron and Desiree Bolton have been participating and volunteering for Seek the Peak for three years now. Together, they comprise Team Cloud Chasers
Celebrating 250 Years: The Declaration’s Legacy in the White Mountains
Celebrating 250 Years: The Declaration's Legacy in the White Mountains By Peter Crane We are now approaching July Fourth, Independence Day, the day when we celebrate the adoption of the Declaration of Independence in
Seek the Peak Spotlight: Ryan Shepard
Seek the Peak Spotlight: Ryan Shepard By MWOBS Staff Before Ryan Shepard moved to Conway, he was in Western New York celebrating his 40th birthday party. “I wanted to go big,” he said. “Big”
