Reflections on a Summer of Research
2017-08-31 10:54:11.000 – Eric Kelsey, Director of Research
Summer is drawing to a close at the summit. The summer internships have ended and the interns have departed to return to college, or in search of their next adventure or job.
During the summer internships, our six enthusiastic interns honed new analytical skills, learned about mountain meteorology, made their first mountain weather forecasts, and shared their knowledge and excitement of Mount Washington to numerous members and guests at the summit. (If you haven’t already, you can read the interns’ reflections on their internships in their final blog posts during the month of August.)
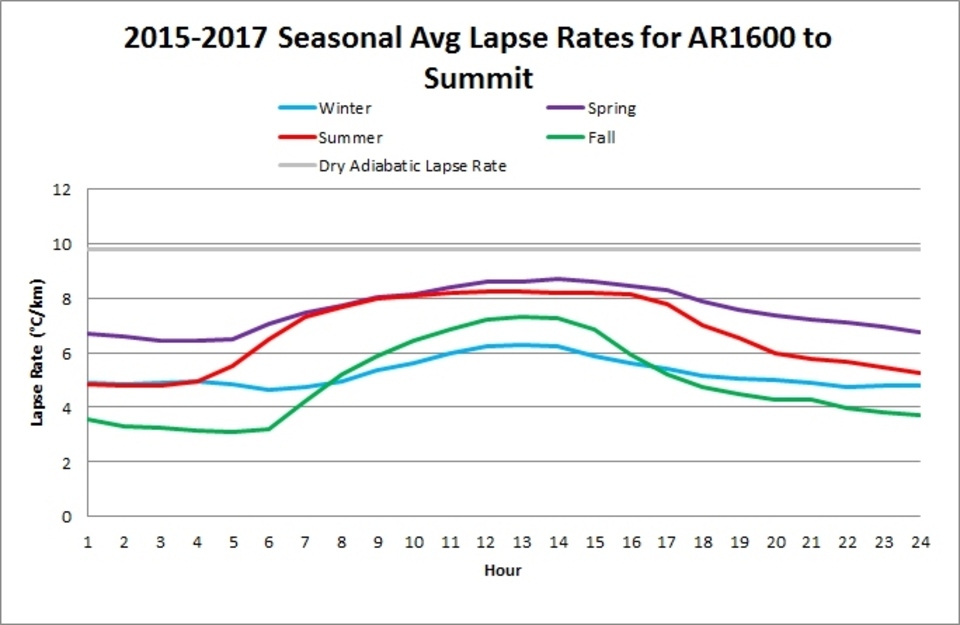
Many of their research project topics aimed to improve our understanding of how temperature and wind vary with elevation around Mount Washington. Nicole and Jillian calculated lapse rates, the rate at which temperature changes with elevation, for Mount Washington using our Auto Road Vertical Profile and two Cog Railway sites. The first figure shows the seasonality of lapse rates between the base of the Auto Road (AR1600’) and the summit. When the solar angle is highest during the spring and summer, daytime lapse rates are highest (i.e., the temperature cools rapidly with increasing elevation). At night the lapse rates are lowest during all seasons because air cools significantly in the valleys while the summit temperature typically does not change as much.
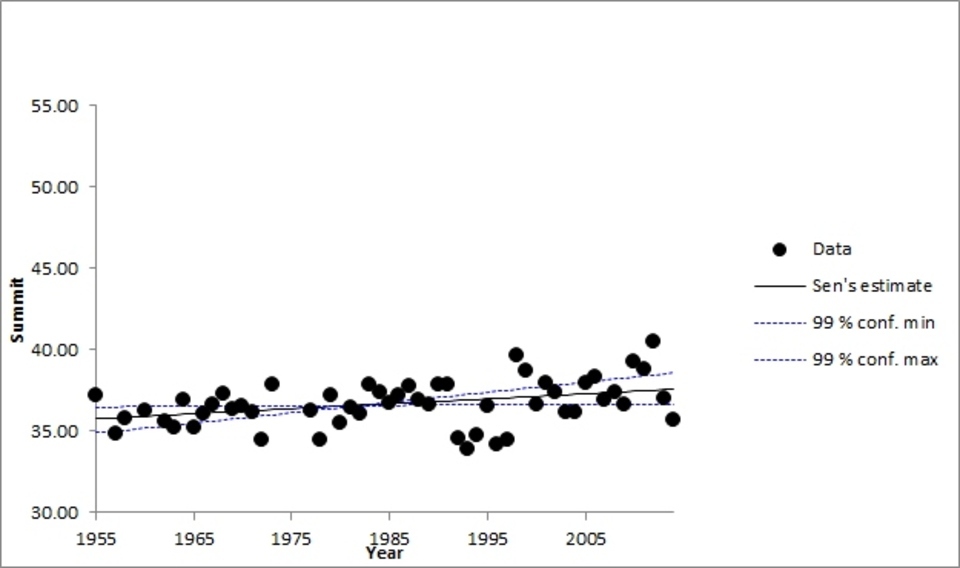
Julia and Elizabeth examined lapse rates on Mount Mansfield, Vermont. We took a trip to view the 4 Mount Mansfield weather stations – one near the summit next to the WCAX TV station building, one on the east slope and two on the west slope. We were dismayed to see some of the temperature sensors were compromised by dirt on the protective radiation shields and/or tilted at an angle, which can allow direct sunlight into the shield and produce an erroneously high temperature reading. Since we do not know if these instrumentation issues are imparting a significant error in the temperatures, they calculated lapse rates with the understanding that the results have considerable uncertainty. They also calculated the temperature trend at the near-summit station and nearby Burlington, Vermont and found that the summit is warming more slowly than the valley – which matches the elevational trends in the White Mountains. The following figure shows the temperature trend (the Sen’s Slope) for Mount Mansfield from 1955-2014. The warming trend during this time period is 0.31 degrees Fahrenheit per decade, only slightly higher than Mount Washington’s warming during this time period. Burlington is warming more than twice as fast at 0.67 degrees Fahrenheit per decade.
Margaret studied times during which wind speeds along the Cog Railway or Auto Road met or exceeded those on the summit. During her brief period of study (2015-2017) there were relatively few events when wind speed along the slopes of the mountain exceeded the summit wind speed at relatively high speeds (>30 mph) when safety begins to be compromised. When they did occur, the higher lower elevation wind speeds occurred when the wind was downsloping (e.g., a west wind for higher Auto Road Vertical Profile wind speeds). This wind orientation is associated with big wind bursts in the lee of large mountains. Locally names for this phenomenon are foehn in the Alps, Santa Ana in southern California and chinook in Colorado. This research into “downslope winds” on Mount Washington will be extended to include the full 13+ year record from the MWO mesonet stations and when we expect to find many more high speed wind events.
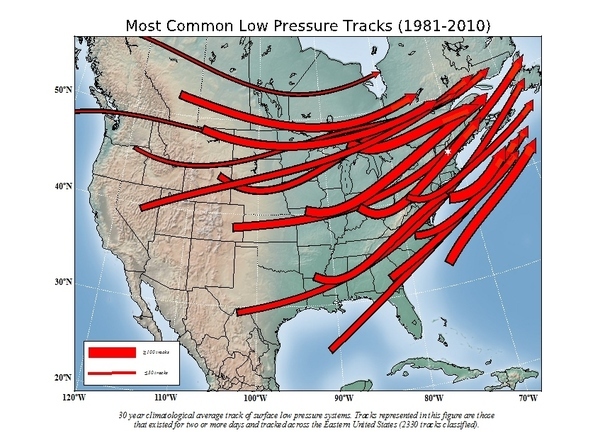
Lastly, Sam plotted common storm tracks across the lower 48 states for the latest climatological period, 1981-2010, the period over which climatological normals (e.g., daily average high and low temperatures) are calculated. The goal was to produce a modern common storm track map to compare with the storm track map we use for tours at the summit. We currently use a map produced by Eugene Van Cleef, published in Monthly Weather Review in 1908, who used weather observations to track storms from 1896-1905. Sam produced additional maps to compare storm tracks by season and between 1981-2010 and 1931-1960, the first 3 decades of MWO’s existence. These new storm track maps will be printed and used during tours at the summit in the near future. A draft map for 1981-2010 is shown here.
It was a pleasure working with all 6 interns this summer. They worked hard, learned new analytical skills, honed communication skills, and learned a lot about how the atmosphere behaves around Mount Washington. Thank you for your hard work helping to advance the research and education mission of Mount Washington, and best wishes in your future endeavors!
Eric Kelsey, Director of Research
A Look at The Big Wind and Measuring Extreme Winds At Mount Washington
A Look at The Big Wind and Measuring Extreme Winds at Mount Washington By Alexis George Ninety-one years ago on April 12th, Mount Washington Observatory recorded a world-record wind speed of 231 mph. While
MWOBS Weather Forecasts Expand Beyond the Higher Summits
MWOBS Weather Forecasts Expand Beyond the Higher Summits By Alex Branton One of the most utilized products provided by Mount Washington Observatory is the Higher Summits Forecast. This 48-hour forecast is written by MWOBS
One Down, One To Go
One Down, One to Go By Ryan Knapp On my calendar for March 2025, I had two reminders of events to look forward to in the sky. The first occurred this past week with

