Slide Show
2008-03-03 18:34:56.000 – Ryan Knapp, Staff Meteorologist
Sunrise Cap Cloud
With the end of one month (February) and the start of another (March), that means one thing for the staff meteorologist: Monthly Summary. This is when I crunch through the numbers and find out climatological stats for the summit. I always like to relay this information on to you the reader by an interesting method each month. So for this month, I will relate the information by a slide show of sorts. So I will be like the friend or neighbor that forces you (usually after a dinner party) to sit through pictures as they talk.
Here is slide one. This is called a sling psychrometer. It is one method we use to get the hourly temperature outside. When we are in the clear, we go out and spin this devise to get the ambient air temperature. It is a bit more involved, so if you want to learn more, here is a wikipedia link. Last month, our average temperature was 7.2 degrees Fahrenheit. This was 0.6 degrees above normal.
Here is slide two. This is called a thermoshack. Inside, two thermometers are housed that record the six hourly maximum and minimum. Then, at the end of the day we determine what the highest and lowest temperatures were based off the four six-hourly readings we read. So, last month, our highest temperature was 38 Fahrenheit on the eighteenth (a new daily record high beating a previous record or 37 back in 1981). Our lowest temperature was 22 below Fahrenheit measured on the eleventh. The record high was the only record temperature set last month.
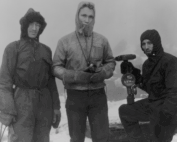
Here is slide three. This is me on the left holding the precipitation can and Brian on the right when we first started here back in the first part of 2006 as interns. This can is collected every six hours and is how we measure snow as well as other types of precipitation. Anything that falls in here eventually gets melted (if not already melted) carefully to provide us with the melted equivalent of precipitation. Last month, we received 6.76 inches of precipitation which was 0.57 inches below normal. The most we measured in a 24 hour period was 1.70 inches starting on the first and carrying over into the second.
Here is slide four. This is a picture of the snowpack we have up here. Last month, we received 47.2 inches which was 4.8 inches above normal. Our largest measured amount in a 24 hour period was 8.2 inches from the sixth into the seventh. Now, I have read in countless news articles and NWS statements that snowfall in many parts of New England have or are on the verge of setting monthly and seasonal records. But, you may be surprised to learn that the summit of Mount Washington is no where near setting a record. For the season (which starts in July for all stations), our seasonal total is 170.3 inches. That may sound decent but surprisingly, that is 31.9 inches below normal for the season. That’s right, BELOW average. Also, it is no where near our record setting season of 1968/69 in which 566.4 inches fell. But we did have 21 days with snow recorded with only 5 days with some amount of rain recorded.
Here is slide five. This is a picture of our pitot tube static anemometer. This is how we measure wind speed up here year round using a method of pressure differences. On clear days, we also use a sonic anemometer. You can click their names for a more detailed explanation since we have talked about these in past comments. As for wind information, our average wind speed for the month was 40.2 mph, which was 2.8 mph below normal. We reached a peak wind gust of 118 mph from the southwest on the second. We had 15 days where the wind gusts were 73 mph or more. We only had three days where wind gusts were 100 mph or more.
Here is slide six of a sunset from my last shift. We didn’t get too many of these since we only received 33 percent of the total possible sunshine minutes in the month.
Here is slide seven. This is what a clear day looks like. Although there is an undercast, it is counted as clear above. We only received three of these last month.
Here is slide eight. This is what a partly cloudy day looks like. We only received five of these last month.
Here is slide nine. This is what a cloudy day looks like. We had 21 days of either cloudy skies or total fog cover.
Here is slide ten. This is a common site up here. It is of fog, in which we received 29 days in which we recorded at least 15 minutes of fog. But usually the fog was around for much longer than 15 minutes.
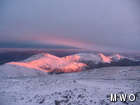
Lastly, here is slide eleven, twelve and thirteen. These have nothing to do with monthly summary. These are of a cap cloud this morning that caught the rising suns rays. I stayed up to watch sunrise since this was a nine out of ten sunrise for me. I score all my sunrises and sunsets ever since I worked with former observer Jim Salge. A perfect 10 sunrise (one of many) was captured by Jim in April of 2006. It looked like this.
Ryan Knapp, Staff Meteorologist
A Look at The Big Wind and Measuring Extreme Winds At Mount Washington
A Look at The Big Wind and Measuring Extreme Winds at Mount Washington By Alexis George Ninety-one years ago on April 12th, Mount Washington Observatory recorded a world-record wind speed of 231 mph. While
MWOBS Weather Forecasts Expand Beyond the Higher Summits
MWOBS Weather Forecasts Expand Beyond the Higher Summits By Alex Branton One of the most utilized products provided by Mount Washington Observatory is the Higher Summits Forecast. This 48-hour forecast is written by MWOBS
One Down, One To Go
One Down, One to Go By Ryan Knapp On my calendar for March 2025, I had two reminders of events to look forward to in the sky. The first occurred this past week with


