
Overview of Rain on Snow Research
By Charlie Peachey
Below is a summary of findings from current research on rain on snow events, defined as liquid precipitation on existing snowpack, occurring on the summit of Mount Washington from September 1989 through May 2020. The scope of the study, available in full on our research webpage, aims to accurately establish and quantify climate trends related to extreme weather events occurring within this timeframe, and will be achieved by taking the 3, 5, and 10 year averages looking at overall temperature, wind, and precipitation changes as well as selecting the outliers for the same period to look at changes in the extreme weather that impact the summit of Mount Washington.
This study will further investigate the changing seasonality around the winter on Mount Washington to determine if winters are warming and if this is impacting the summit snowpack as well as shifting the seasonality. By isolating winter precipitation events when there is a definable snowpack on the ground, it will be possible to see if there has been an increase in ROS events on the summit. This will help to determine if the winter precipitation on Mount Washington has been increasing while warmer temperatures allow rainfall increasing icing events and winter water runoff into neighboring ravines and gullies. Determining how winter is impacting Mount Washington will increase the understanding of how climate change is impacting the region in addition to adding to the knowledge of how the fragile high alpine zones will be impacted globally by a continued changing climate.
Statistics of ROS Days
ROS days from 1981 to 2010 and 1991 to 2020 were calculated, analyzed, and recorded. Overall, the total number of ROS days that occurred in the 1981-2010 climatology was slightly less than in the 1991-2020 climatology, with 1016 ROS days and 1190 ROS days, respectively. That averages out to around 34 ROS days per year for 1981-2010 and 40 ROS days for the 1991-2020 climatology. However, only about 2% of those ROS days occurred during the warmer months of June, July, August, and September for both climatologies. Furthermore, the month that experienced the most amount of ROS days for both climatologies was April with an average of 7-8 ROS days per month, but there was also a secondary local maximum in ROS days during November for 1981-2010, with an average of around five days per month. There is also a secondary maximum for the 1991-2020 climatology that occurs in December, with an average of around six days per month.
Long Term Trends of ROS Observations from 1981-2020
An attempt was made to evaluate ROS observations as opposed to ROS days over the entire range of years from 1981-2020, but the results tended to be messier than when ROS days were analyzed for the two climatologies independently. Out of all the graphs produced and statistical tests completed, ROS observations for 1981-2020 had the lowest statistical significance. It failed the Mann-Kendall test at the 5% significance level with a value of around 14%. Furthermore, the Theil-Sen slope produced in Figure #1 had a slope value of 0.00 and a coefficient of determination of -0.03, so it is also a statistically insignificant result. It was the least significant result of any graph produced during the study.
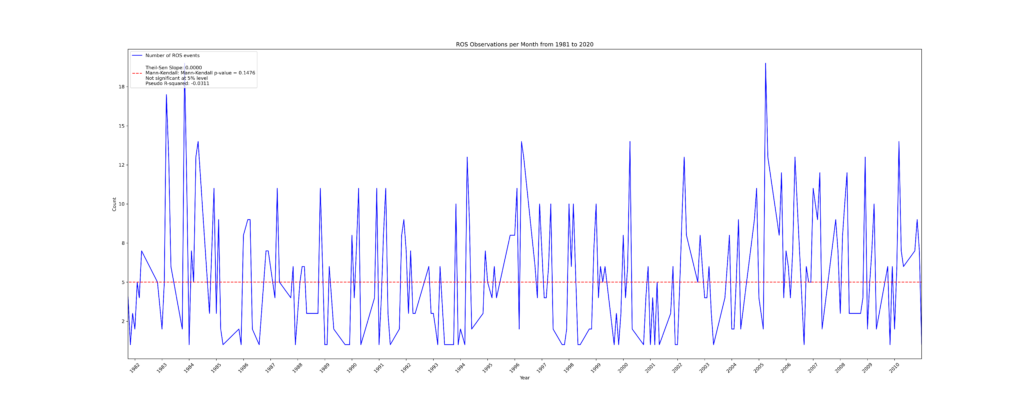
Figure #1: ROS observations per Month from 1981 to 2020. The red line is the calculated Theil-Sen slope and the blue line is the number of ROS events per month.
Long Term Trends of Each Climatology
After the ROS observations were converted to ROS days and calendar years to winter years, a more statistically significant result was produced for both climatologies. They both passed the Mann-Kendall test at a 5% significance level. The 1991-2020 climatology depicted in Figure #2 had the most significant result, passing the Mann-Kendall test at a 5% and 1% significance level with a value of 0.4%. It also the greatest coefficient of determination produced by the Theil-Sen slope with a value of 0.29. In comparison, the 1981-2010 climatology depicted in Figure #3 was also statistically significant as it passed the Mann-Kendall test at a 5% and 1% significance level with a value of 0.8%. Furthermore, it also had the second–highest coefficient of determination produced by the Theil-Sen slope with a value of 0.21.
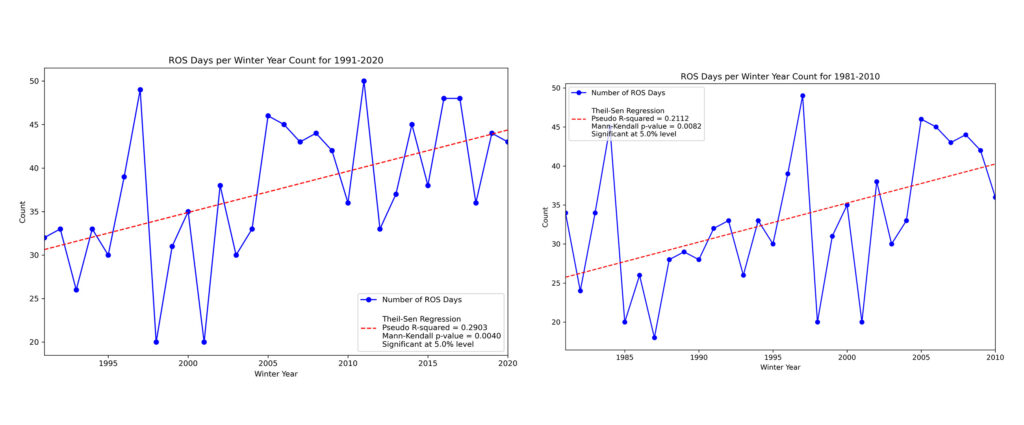
Figure #2 (left): ROS days per Winter Year for 1991-2020 and Figure #3 (right): ROS days per Winter Year for 1991-2020.
Seasonality of ROS Days
Converting ROS observations to ROS days and calendar years to winter years also enabled an evaluation of the seasonality of ROS days. Statistically speaking, there was a 17% increase in the total amount of ROS days from 1981-2010 to 1991-2020, but that wasn’t the most significant increase that was observed across the two climatologies. As seen in Figure #5, the greatest average increase occurred during December, with 46% more ROS days occurring between 1991 and 2020 compared to 1981 and 2010. The subsequent most significant increase was observed in January, with 35% more ROS days occurring between 1991 and 2020 compared to 1981 and 2010.
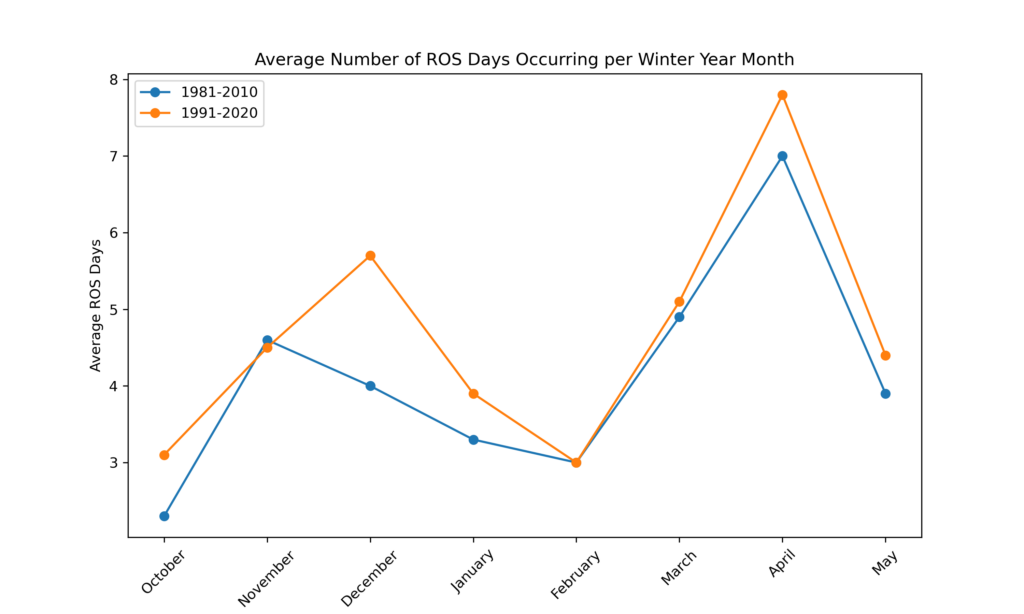
Figure #4: The average number of ROS days that occur during a month which meets our definition of a Winter Year (October – May). The blue line is the average number of ROS days for 1981-2020 and the orange line is the average number of ROS days for 1991-2020.
ROS Events/Duration
A closer look into ROS’s characteristics at the summit revealed several differences between the climatologies. The average duration of a ROS event was the same between climatologies, with an average of 1.7 days, but that was one of the only similarities between them. The only other similarity is the average total snowfall of 3” for both climatologies.
For the 1991-2020 climatology, the average maximum snow depth during a ROS event was 7.6”, but the average maximum snow depth for the 1981-2010 climatology was slightly lower at 6.3”. Similarly, the 1991-2020 climatology had the highest average minimum snow depth at 6.5” as compared to 1981-2010’s average minimum snow depth of 5.5”. Furthermore, there was also a difference in the average total liquid precip between the two climatologies, but the 1991-2020 climatology had a lower average at 0.99” as compared to the 1981-2010 climatologies average of 1.13”.
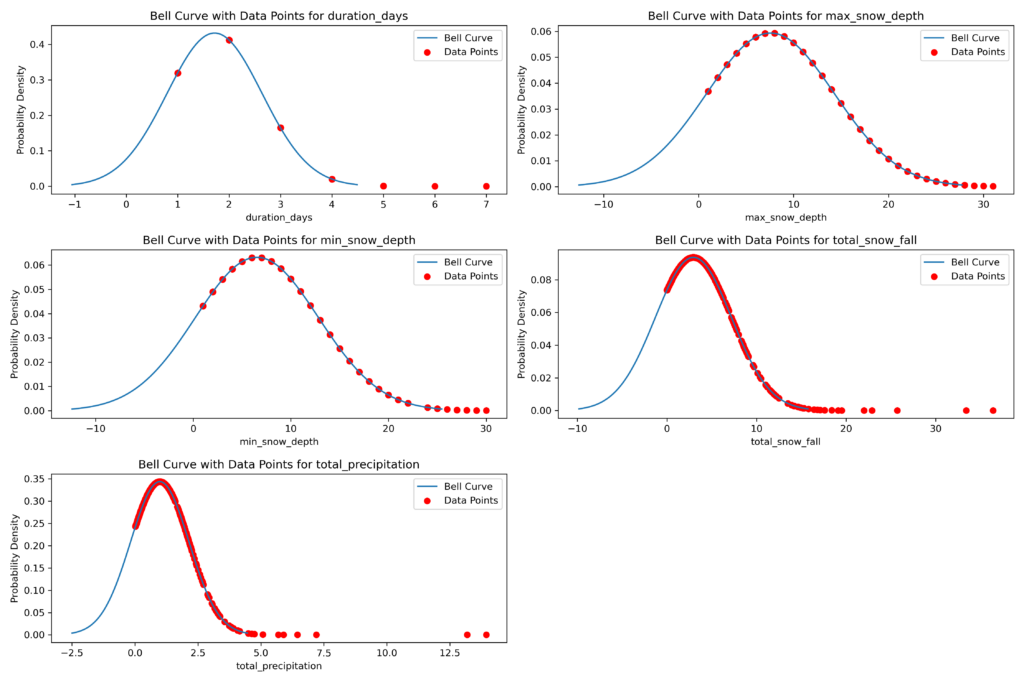
Figure #5: Bell curves with data points plotted on them for all statistics calculated in the ROS event data set for 1991-2020.
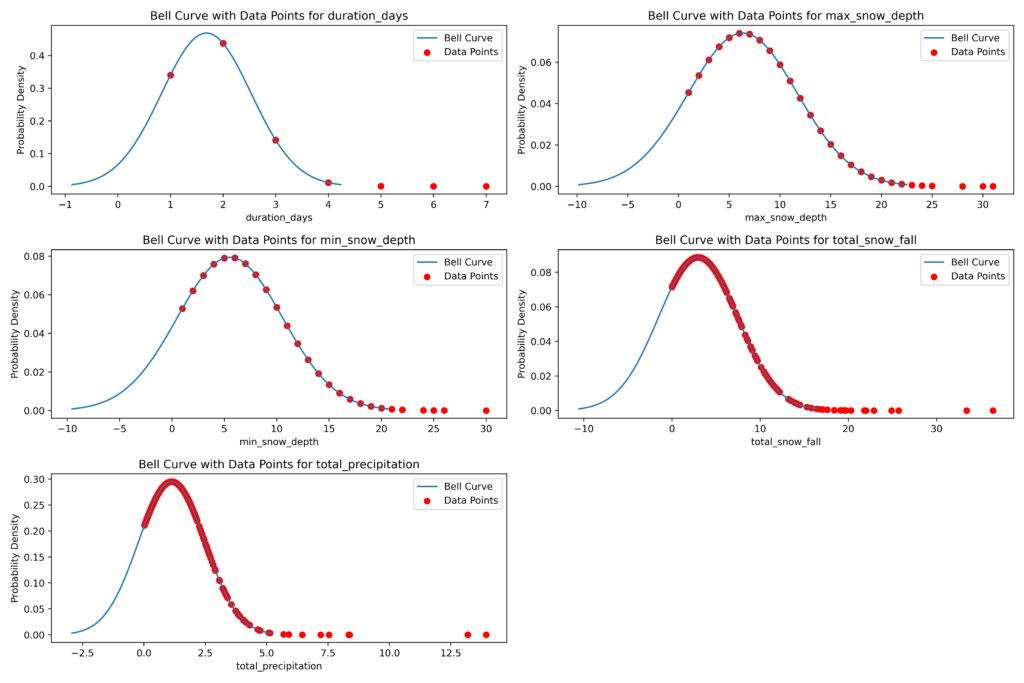
Figure #6: Bell curves with data points plotted on them for all statistics calculated in the ROS event data set for 1981-2010.
Conclusions
Seasonality of ROS Days
The work done in this study brought together temperature, snow metrics, and other meteorological variables recorded during four decades at Mount Washington, NH, from 1981-2020, which revealed a general seasonality of ROS days on the summit and a shortening winter season. Generally, the two most common times of the year for ROS days to occur at the summit in this study were early winter and early to mid–spring, and almost all ROS days occurred from October to May. Therefore, our results align well with a previous study by Mccabe et al. (2007) which determined the most common months for ROS are also from October to May. However, when comparing the two climatologies, it became apparent that there has been a shift in the seasonality of ROS days in recent years.
For the 1981-2010 climatology, the peak in early winter occurred in November with an average of around 4.5 ROS days per year. However, for the 1991-2020 climatology, the peak in early winter occurred in December with an average of 5.9 ROS days per month. The resulting increase in December was the largest out of any other month, with a value of 46%. However, the most ROS days occurred in April for both climatologies, with around 7-8 ROS days per month. However, the overall increase in ROS events during April across both climatologies was relatively small compared to the other months, and there wasn’t a shift in the peak month like there was for the early winter peak. Therefore, this shift towards ROS days occurring later in the winter but during the same month in the spring indicates a shortening winter season.
This shift is also visually depicted in Figure #4 and aligns well with the results obtained by Murray et al. (2021). Temperatures at the summit in recent decades have warmed dramatically in the winter, with December having one of the highest warming rates compared to any other month, 0.22°C per decade (Murray et al. 2011). Additionally, during the past 15 years, the rate of warming at the summit has been faster than any 15-year period since 1935 and has begun to produce statistically significant long-term trends (Murray et al. 2011; Seidel et al. 2009). Therefore, the recent warming trends found by Murray et al. (2021) and the older warming trends found by Seidel et al. (2009) further explain why December experienced the largest increase in the average amount of ROS days relative to any other month across both climatologies analyzed in this study.
Weakening Snow Pact/Delay in Development of Snow Pact
The significant increase in ROS days in December across the two climatologies also supports the fact that the snowpack on the summit has weakened over the past few decades because of ROS days occurring later in the year. The liquid precipitation types associated with ROS events tend to destabilize a snow pact due to their freeze-thaw cycles and overall snow melt (Il Jeong and Sushama 2018). Once a snowpack becomes destabilized by a ROS event, it often results in a weaker snowpack that can melt more easily (Singh et al. 1997). Increasing ROS events in December also means that the summit can’t start building its annual snow pack until later in the winter. Therefore, the snowpack on the summit is expected to weaken yearly as ROS days become increasingly prevalent in mid to late winter.
Additionally, other studies have previously observed trends in winter-thaw events at the summit and found increases in the duration and magnitude of said events when the dew point is warmer than 0°C, which is indicative of potential increases in snow-depth loss over time (Kelsey and Cinquino 2021). It is also further evidence of how ROS days have been increasingly weakening the snow pact over time since ROS days are often defined as having a temperature or dew point above 0°C and are frequently associated with winter thaw events (Tao et al. 2023; Würzer et al. 2016).
Combining our results with the results of Kelsey and Cinquino (in press) reveals how ROS events at the summit have changed in recent years. Trends in ROS characteristics show that rapidly warming falls and winters in recent decades have resulted in more ROS events occurring later into winter than ever. Moreover, winter-thaw events with dew points greater than 0°C have been proven by Kelsey and Cinquino (press) to increase duration and magnitude in recent years at the summit. Therefore, the amount of ROS days occurring in mid to late winter has been increasing in recent years due to rapidly warming temperatures in December and winter-thaw events that have become longer and more powerful. So, storms that impacted the summit could stay as liquid precipitation instead of solid further into the winter and for a longer duration, which exacerbated the weakening of the snowpack.
Long-term Trends: Increasing Number of ROS Days from 1981 to 2020
Predictions made by previous studies have stated how the frequency of ROS events will likely increase in high–elevation areas in the coming decades (Surfleet and Tullos 2013). Specifically, in a warmer future, areas around 2,000 and above in the Western US will see ROS days increase in frequency while the rest of the CONUS will mainly experience a decrease (Li et al. 2019). However, the results of this study have revealed that the summit has seen an increase in the frequency of ROS days in recent years despite being on the east coast. All slopes calculated by the Theil-Sen slope estimator and shown in figures #3 and #4 were positive for the annual amount of ROS days but had relatively weak coefficients of determinations. Furthermore, both climatologies passed the Mann-Kendall tests that were performed at the 5% significance level and the test at the 1% significance level.
With the summit being at an elevation of 1916m, it is almost at the expected elevation where ROS will increase in the west at 2000m (Li et al. 2019). Additionally, Li et al. (2019) discussed the regions of the CONUS with the highest historical frequency of ROS events, with the northeast being one of the primary four. Being near a large body of water, such as the Atlantic Ocean, tended to produce the highest frequencies of ROS events. In the northeast, warm, humid air from a body of water enables large snow accumulations in the winter and rainfall in the spring, resulting in the best conditions for large ROS events (Li et al. 2019). So, the summit is most likely experiencing an increasing frequency of ROS events due to the proximity to the Atlantic Ocean and its elevation above sea level, despite other studies concluding that the East Coast is more likely to see a decreasing frequency of ROS events (Li et al. 2019).
In terms of climate change, the annual amount of precipitation that has fallen on the summit hasn’t changed much over recent winters, but the proportion that has fallen as rain as opposed to snow has increased. As our study has shown, there is generally an increasing trend in terms of the number of ROS days experienced at the summit over recent decades. Therefore, the increasing number of ROS days is evidence that that storms in recent years have been warming enough to transition snow to rain during the winter months.
Furthermore, another trend found by this study showed that the peak of ROS days in the early winter has been shifting later into the year; which further supports the idea that proportion of precipitation that falls as rain as opposed to snow is increasing. It also reveals how the recent snow pact at the summit has become weaker in the early winter than in previous decades. With more ROS days occurring in December, the amount of melting that will occur among the summits snow pack will increase.
As the work in our case study showed, a weaker and thinner snowpack earlier in the year can lead to potentially more impactful ROS events. This was further proven by a detailed analysis of the December 18-19, 2023 since it tended to be one of the most impactful flooding events in recorded history for various streams branching off from the summit. Taking place over the course of 31 hours, this event produced 4.1 inches of rainfall at the Mount Washington summit, almost completely eradicating snowpack at all elevations. The event caused major flooding at a majority of the examined gauges and generated daily runoff numbers higher than any other non-spring ROS event in over a century. Calculated recurrence intervals for these discharge values reached nearly 800 years. As the frequency of these events increases in the region, it is possible that ROS floods of this magnitude will begin to become more common. Given the extent of damages caused by this event, the implications of increased frequency of these floods could be significant for those communities and ecosystems on and below Mount Washington. Furthermore, the characteristics of the December 18-19, 2023 ROS event also aligned with the characteristics of ROS events that were found for our study ROS event.
In conclusion, the results show the importance of understanding the characteristics and long term trends of ROS events at the summit of Mount Washington. Other than tropical storms, ROS events have resulted in some of the most severe flooding events around the Mount Washington area. With more ROS days expected to occur in the future, being able to gain a better understanding of how to forecast for them and how to best prepare for them will be crucial for mitigating their impacts. Therefore, there is still a need to understand the weather patterns that commonly cause ROS events in order to be better prepared for them in the future. Additionally, further work examining the factors contributing to the historic runoff of the December 2023 ROS event would greatly benefit understanding of ROS flooding in the Northeast.
To learn more about the team’s rain on snow research, visit https://mountwashington.org/research/current-research-projects/rain-on-snow/.
References
Il Jeong, D., and L. Sushama, 2018: Rain-on-snow events over North America based on two Canadian regional climate models. Clim Dyn, 50, 303–316, https://doi.org/10.1007/s00382-017-3609-x.
Kelsey, E. P., and E. Cinquino, 2021: The climatological rise in winter temperature-and dewpoint-based thaw events and their impact on snow depth on mount washington, new hampshire. J Appl Meteorol Climatol, 60, 1361–1370, https://doi.org/10.1175/JAMC-D-20-0254.1.
Li, D., D. P. Lettenmaier, S. A. Margulis, and K. Andreadis, 2019: The Role of Rain-on-Snow in Flooding Over the Conterminous United States. Water Resour Res, 55, 8492–8513, https://doi.org/10.1029/2019WR024950.
Mccabe, G. J., M. P. Clark, and L. E. Hay, 2007: Rain-on-Snow Events in the Western United States. Bull Am Meteorol Soc, 88, 319–328, https://doi.org/10.1175/BAMS-88-3-3I9.
Murray, G. L. D., and Coauthors, 2011: Northeastern Naturalist Climate Trends on the Highest Peak of the Northeast: Mount Washington, NH. 64–82 pp.
Seidel, T., D. Weihrauch, K. Kimball, A. Pszenny, R. Soboleski, E. Crete, and G. Murray, 2009: Evidence of climate change declines with elevation based on temperature and snow records from 1930s to 2006 on Mount Washington, New Hampshire, U.S.A. Arct Antarct Alp Res, 41, 362–372, https://doi.org/10.1657/1938-4246-41.3.362.
Singh, P., G. Spitzbart, H. Hübl, and H. W. Weinmeister, 1997: Hydrological response of snowpack under rain-on-snow events: a field study. 1–20 pp.
Surfleet, C. G., and D. Tullos, 2013: Variability in effect of climate change on rain-on-snow peak flow events in a temperate climate. J Hydrol (Amst), 479, 24–34, https://doi.org/https://doi.org/10.1016/j.jhydrol.2012.11.021.
Tao, J., X. Cheng, L. Zheng, X. X. Xiao, X. Y. Zhong, Q. Liang, Z. Q. Zhang, and H. Lin, 2023: Performance of climate reanalyses in the determination of pan-Arctic terrestrial rain-on-snow events. Advances in Climate Change Research, 14, 522–536, https://doi.org/10.1016/j.accre.2023.08.002.
Würzer, S., T. Jonas, N. Wever, and M. Lehning, 2016: Influence of initial snowpack properties on runoffformation during rain-on-snow events. J Hydrometeorol, 17, 1801–1815, https://doi.org/10.1175/JHM-D-15-0181.1.

Seek the Peak Spotlight: The Cloud Chasers
Seek the Peak Spotlight: The Cloud Chasers By MWOBS Staff Mike Bergeron and Desiree Bolton have been participating and volunteering for Seek the Peak for three years now. Together, they comprise Team Cloud Chasers
Celebrating 250 Years: The Declaration’s Legacy in the White Mountains
Celebrating 250 Years: The Declaration's Legacy in the White Mountains By Peter Crane We are now approaching July Fourth, Independence Day, the day when we celebrate the adoption of the Declaration of Independence in

Seek the Peak Spotlight: Ryan Shepard
Seek the Peak Spotlight: Ryan Shepard By MWOBS Staff Before Ryan Shepard moved to Conway, he was in Western New York celebrating his 40th birthday party. “I wanted to go big,” he said. “Big”
